Cosmograph web application
Cosmograph is a workspace for loading graph or embedding data, configuring an interactive visualization, exploring its structure, and sharing the result with others.
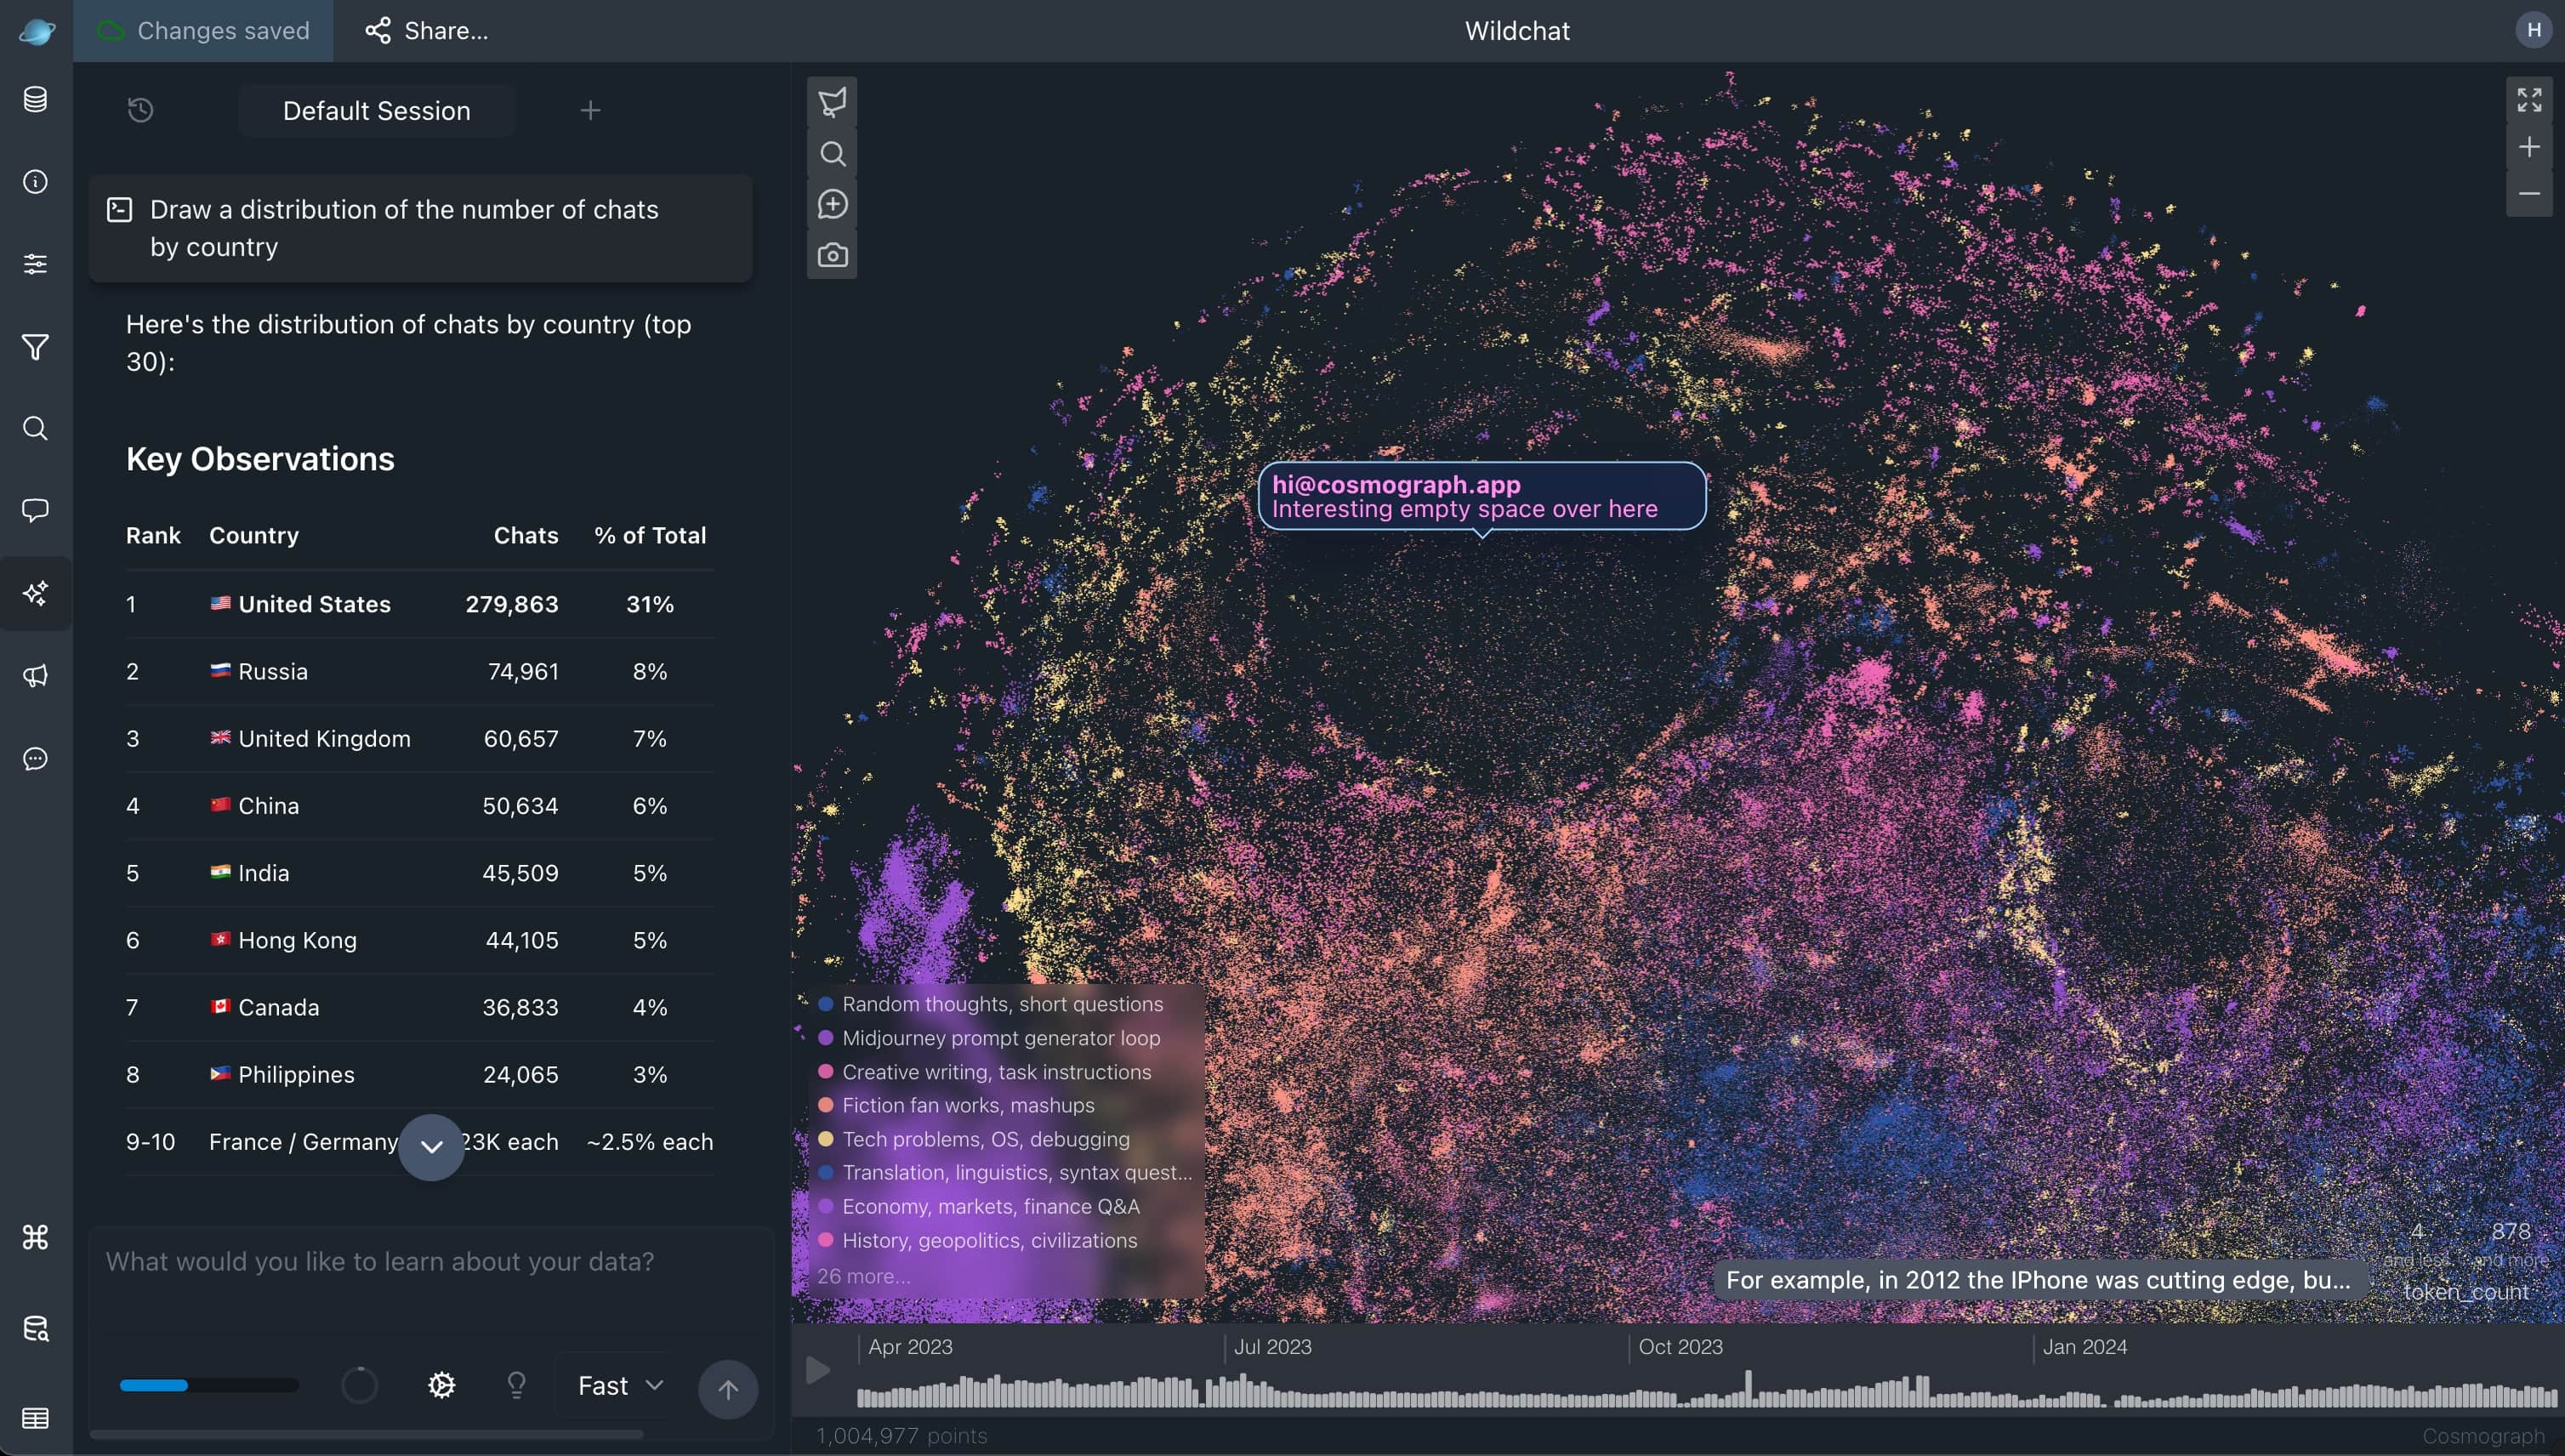
This guide covers the current application workflow. Use the focused guides for Sharing, Discussions, Plans, and AI Assistant when you are ready to collaborate or use paid features.
Start a graph
Open Cosmograph and select New graph from the Graphs page. You can work on a graph before signing in, but sign in to save it to your account.
Saved graphs appear in Graphs. That page separates graphs you own from graphs shared with you directly or through a team.
Add data
Use the data setup screen or the Data Sources panel to add your graph data. Cosmograph accepts these uploaded file formats:
- CSV and TSV
- JSON and NDJSON
- Parquet and PQ
- Apache Arrow
For a network graph, add a links table and map its source and target columns. You can also add a points table with a unique ID and optional properties such as labels, colors, sizes, or coordinates.
For an embedding, add a points table with an ID and coordinate columns (X/Y, and optionally Z for 3D). Additional columns can be used to style, label, group, filter, or inspect points.
The data setup flow helps map your columns. If the automatic mapping is not right, adjust it before returning to the graph.
Configure and explore
The project panels keep the main workflow close to the graph:
- Data Sources: add files, review tables, and map graph columns.
- Graph configuration: control point and link appearance, labels, and simulation settings.
- Graph dimensions: switch between 2D and 3D. In 3D, Cosmograph runs the GPU force layout in three dimensions with an orbit camera (drag to rotate, scroll to dolly, Shift/Space + drag to pan). Optionally map a Z position column for embeddings and other precomputed 3D layouts.
- Filters, Search, and Dataset Tables: focus on a subset of the data and inspect the rows behind it.
- Assistant: ask questions about the loaded data, create supporting charts, or select matching points on the graph.
- Discussions: leave feedback on the project, a point, or a graph location when you have project access.
Cosmograph is the fastest web-based 3D force graph library available. Use Graph dimensions in the configuration panel to try 3D on your project, or open the live benchmark to compare it with other libraries.
Save your work
Use Save to Cloud or Sync changes in the top bar to save a graph. Free accounts can keep working on unsaved graphs; saved-graph limits and current plan actions are shown in the app. Pro and Team plans include unlimited saved projects.
Share and collaborate
The Share… menu lets an owner publish a read-only graph, protect a published graph with a password, share directly with a registered user, or share with a team.
Published and shared graphs are read-only for viewers and non-owner collaborators. They can explore the graph and, when authenticated with project access, participate in Discussions, but they cannot change, save, or re-share the owner’s source project.
Read Sharing before publishing data or granting access. It explains which sharing option fits each audience, what access it provides, and how to revoke it.
Next steps
- Need a private solo workflow, or teams, roles, seats, and billing? Read Plans.
- Need feedback on a graph? Read Discussions.
- Need help analyzing loaded data? Read AI Assistant.