The fastest graph visualization engine for your app
The state of the art graph visualization and data analytics framework for JavaScript and React.
Powered by in-memory DuckDB for ultra-fast cross-filtering.
 Read the docs
 View examples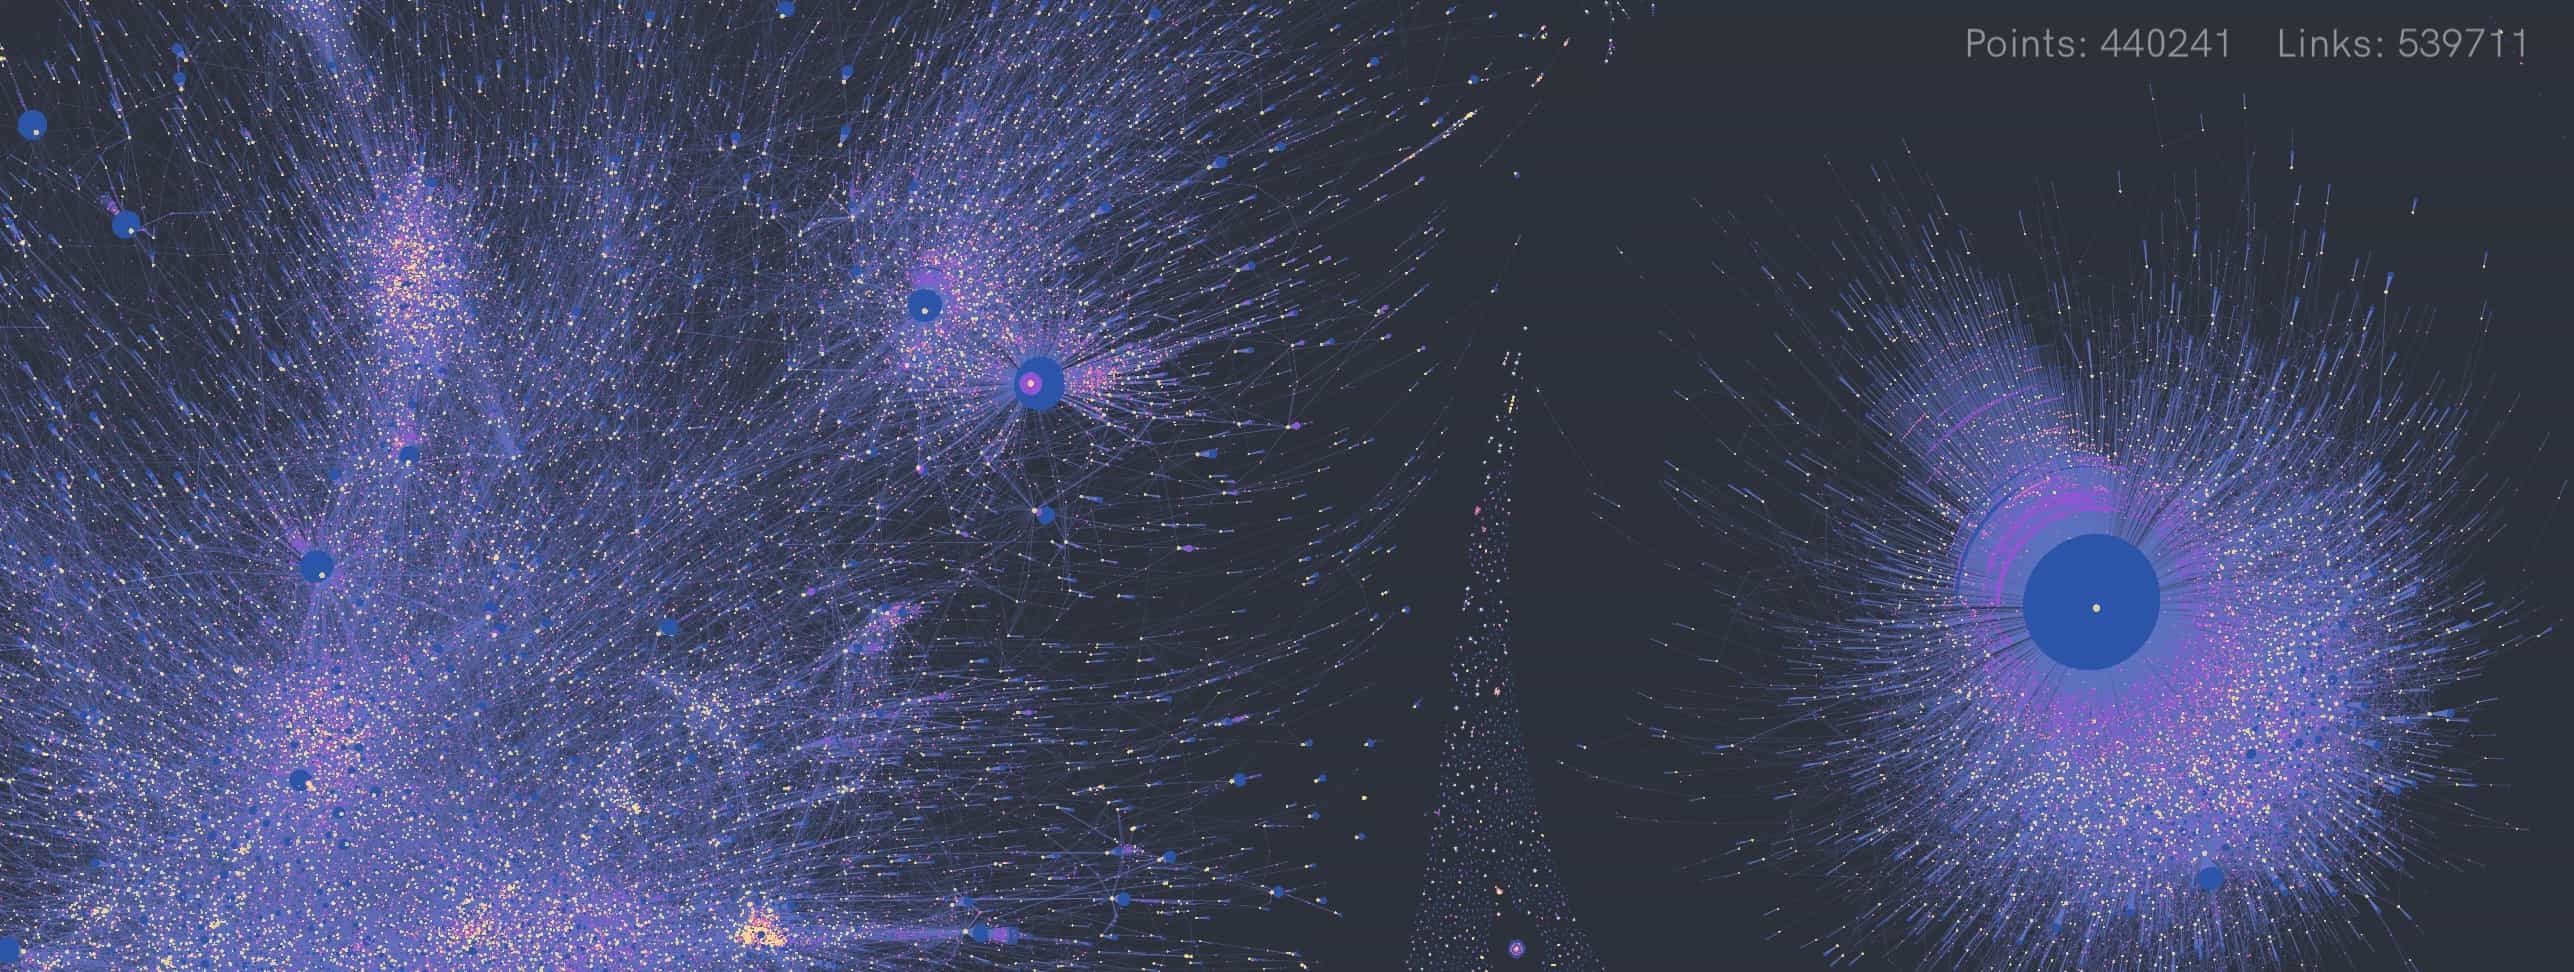
GPU Force Layout and Ultra-Fast Rendering
The simulation runs entirely on the device GPU for real-time layout updates, with no CPU bottlenecks! WebGL rendering, zero-copy data flow, multi-million node graphs.
Built-in Analytics Engine
DuckDB-WASM for in-browser SQL on millions of rows.
Timeline
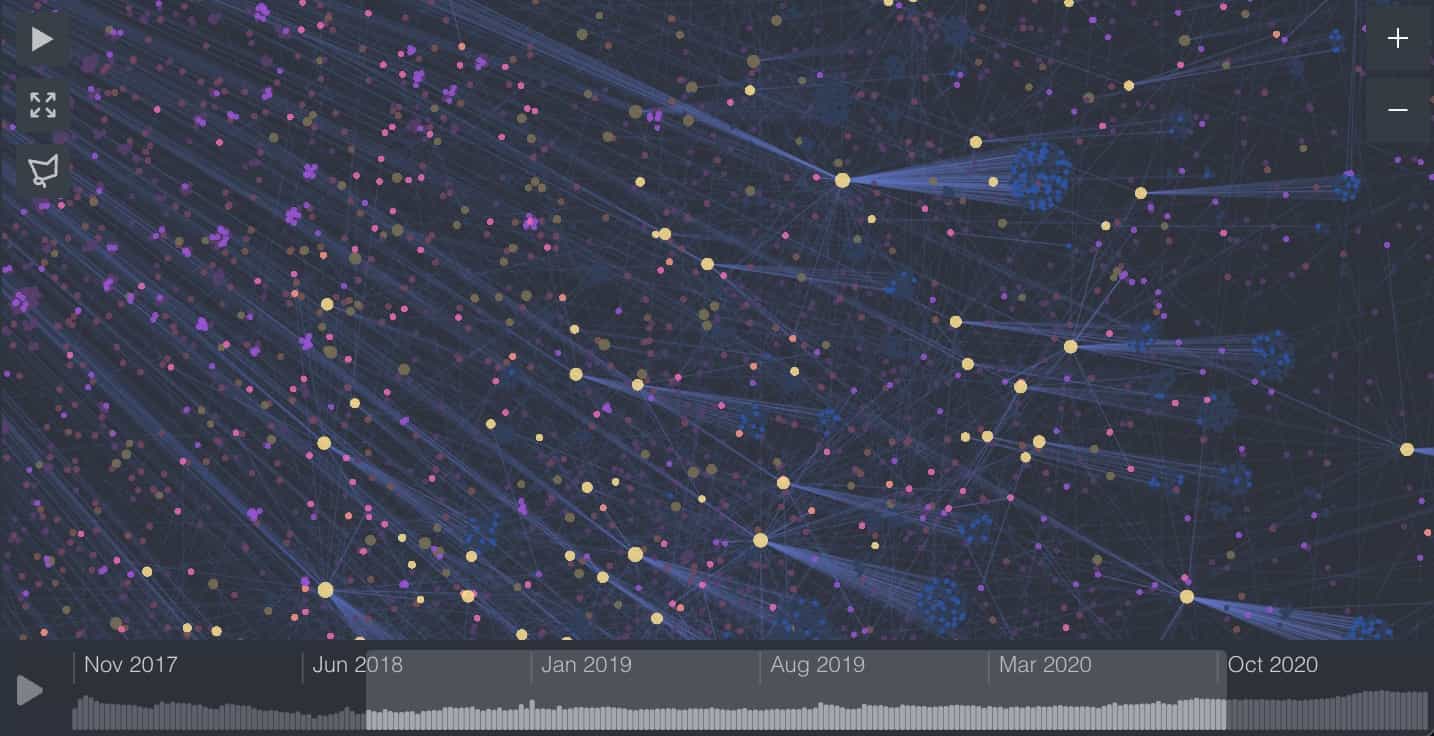
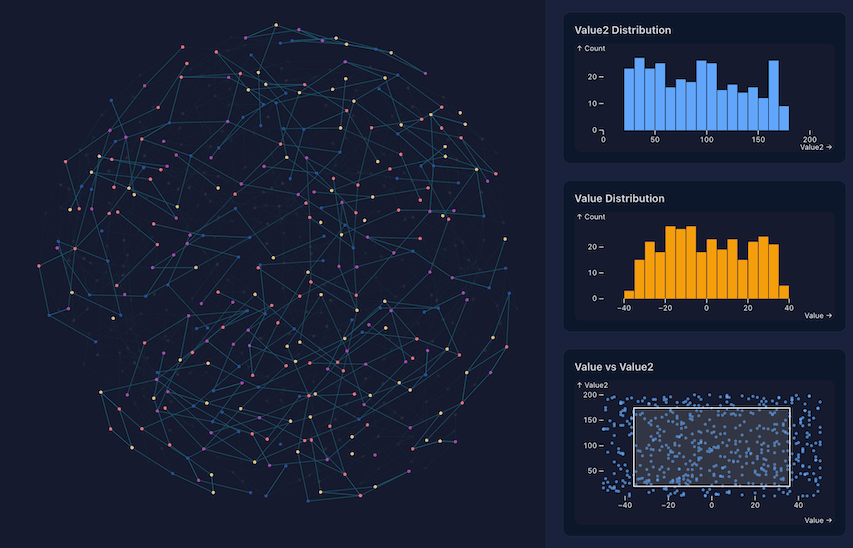
Interval-aware timeline for points and links with adaptive binning from ms to years. Linked brushing updates all views instantly.
Filters & Legends
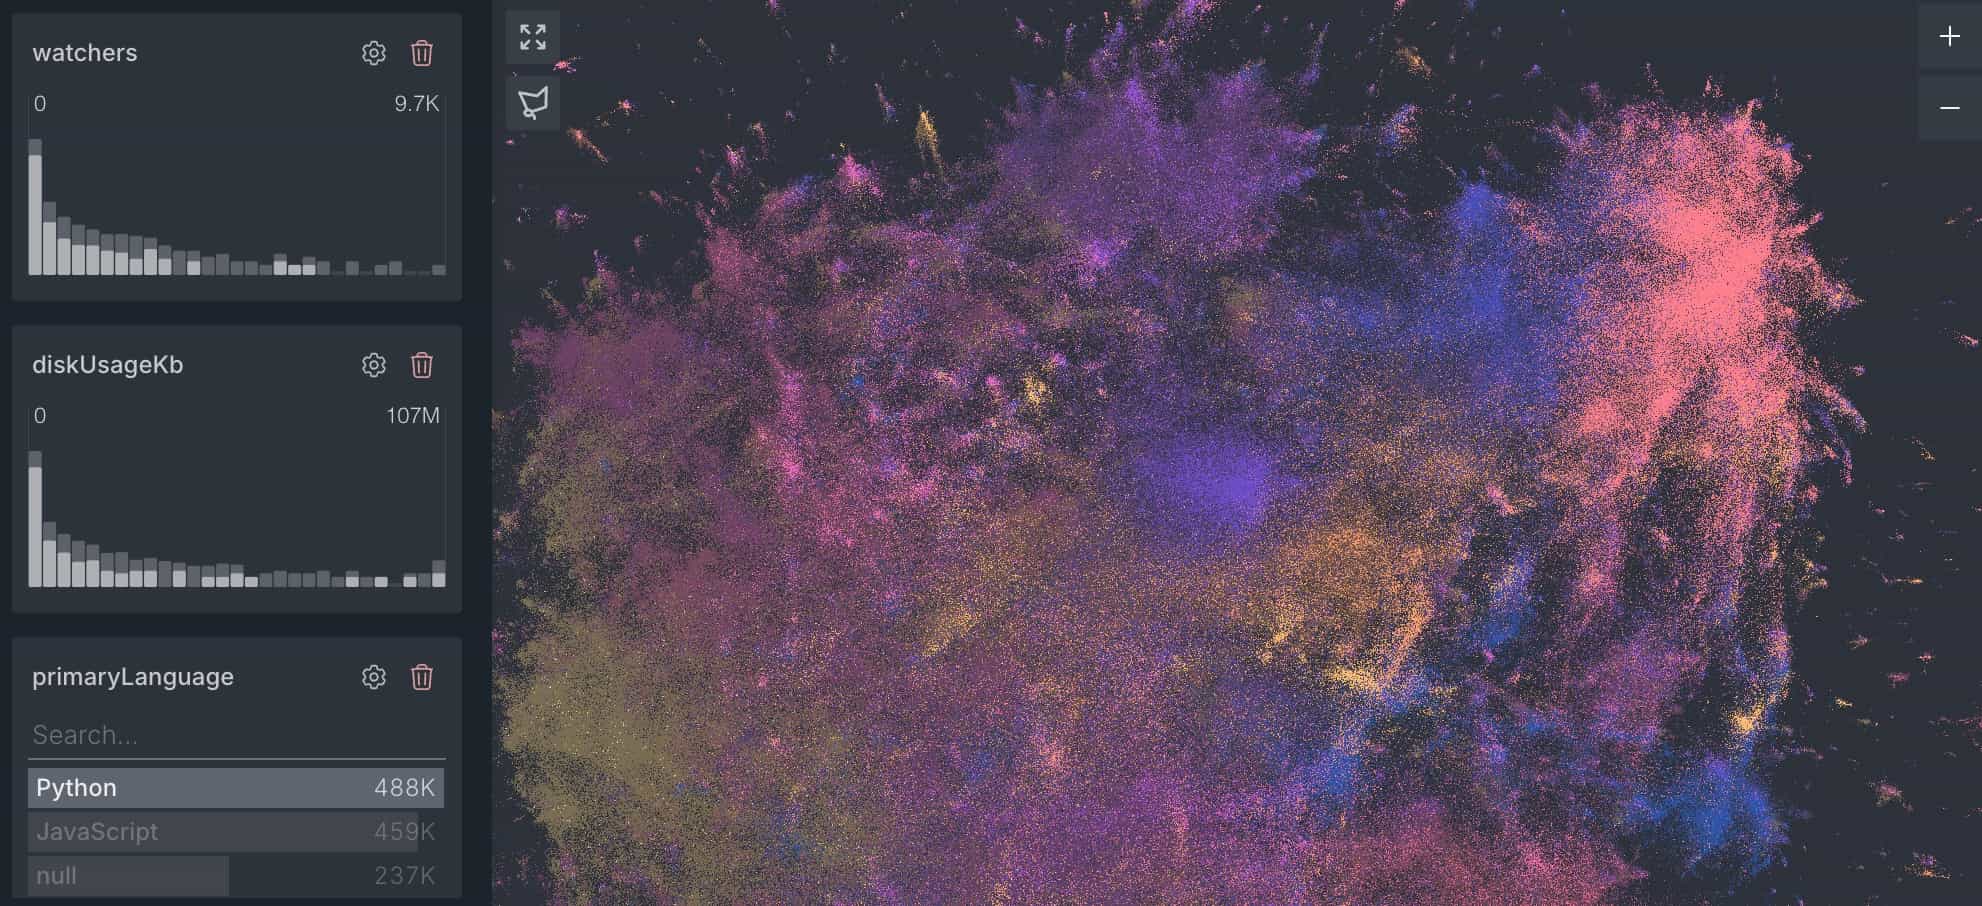
Histograms for numeric, categorical, temporal data with real-time cross-filtering. Built in legend components.
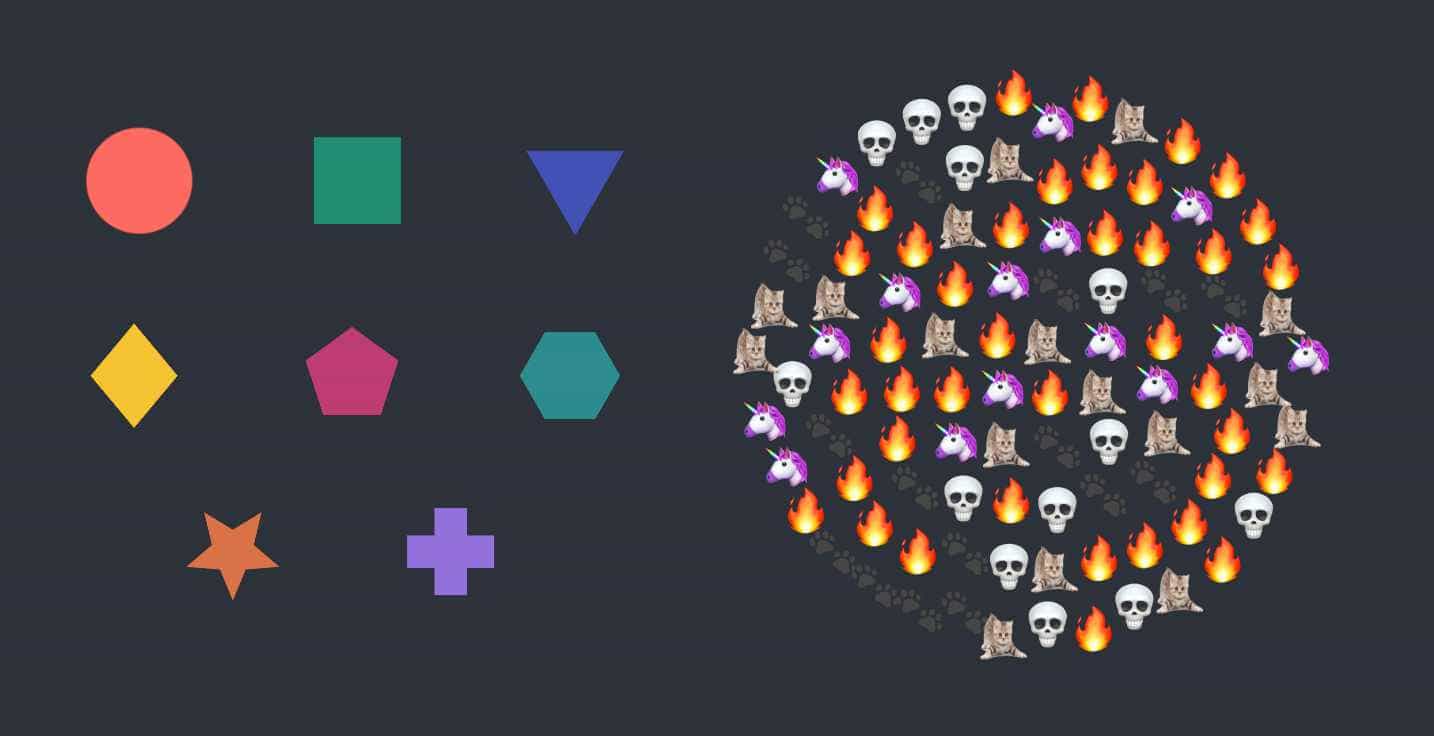
Customization
Custom node shapes, images, curved links, data-driven styles, and more.
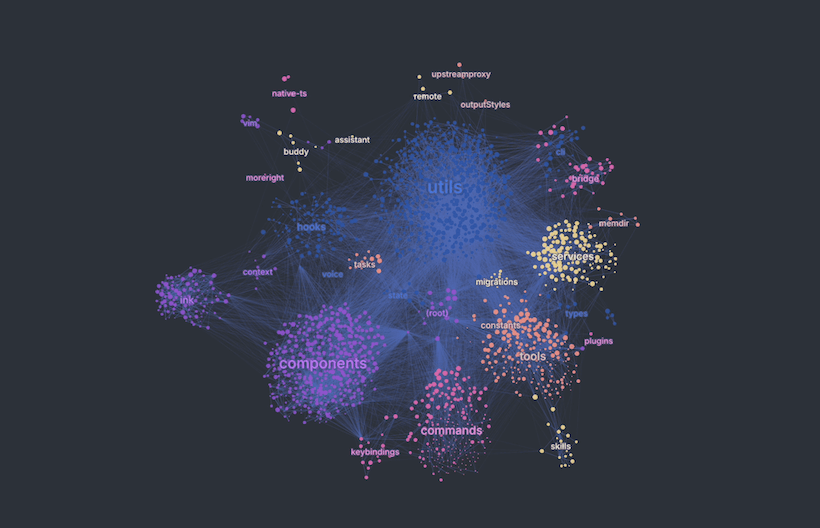
Unique clustering force
Use a dedicated clustering force in the simulation algorithm to reveal structure faster.
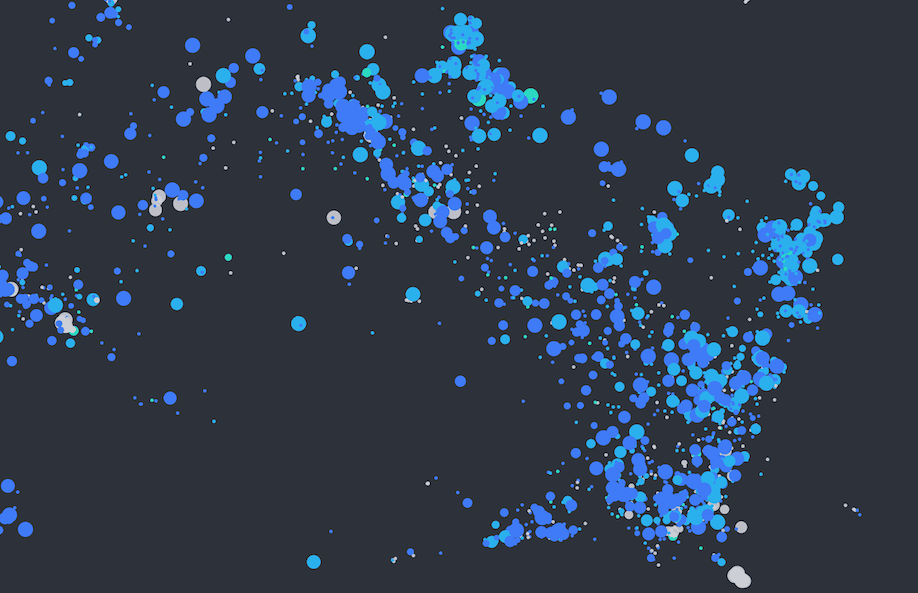
Smooth Camera Controls
Navigate large graphs with fluid programmable camera interactions.
Compare libraries
How Cosmograph stacks up against Sigma.js and react-force-graph-3d. Try the live benchmark →
| Feature | Cosmograph | Sigma.js | react-force-graph-3d |
|---|---|---|---|
| Force Simulation for more than 50K points | Yes | No | No |
| Rendering more than 1M points and links | Yes | Yes | No |
| 3D visualization | Yes | No | Yes |
| Points / Links interactivity | Yes | Yes | Yes |
| Custom point shapes and images | Yes | Yes | Yes |
| Curved Links | Yes | Yes | Yes |
| Point Dragging | Yes | Yes | Yes |
| Clustering Force | Yes | No | No |
| Collision Force | Yes | No | Yes |
| Natively load Parquet / CSV files | Yes | No | No |
| Timeline | Yes | No | No |
| Interactive Histograms | Yes | No | No |
| Additional Charts | Yes | No | No |
Partial means available via a workaround or limited native support.
Try with a simple
npm install
Free for non-commercial use and pre-revenue startups.
Check out pricing for more details.