Showcase
Featured Graphs
From AI and finance to biotech and beyond, turn complex data into actionable maps.
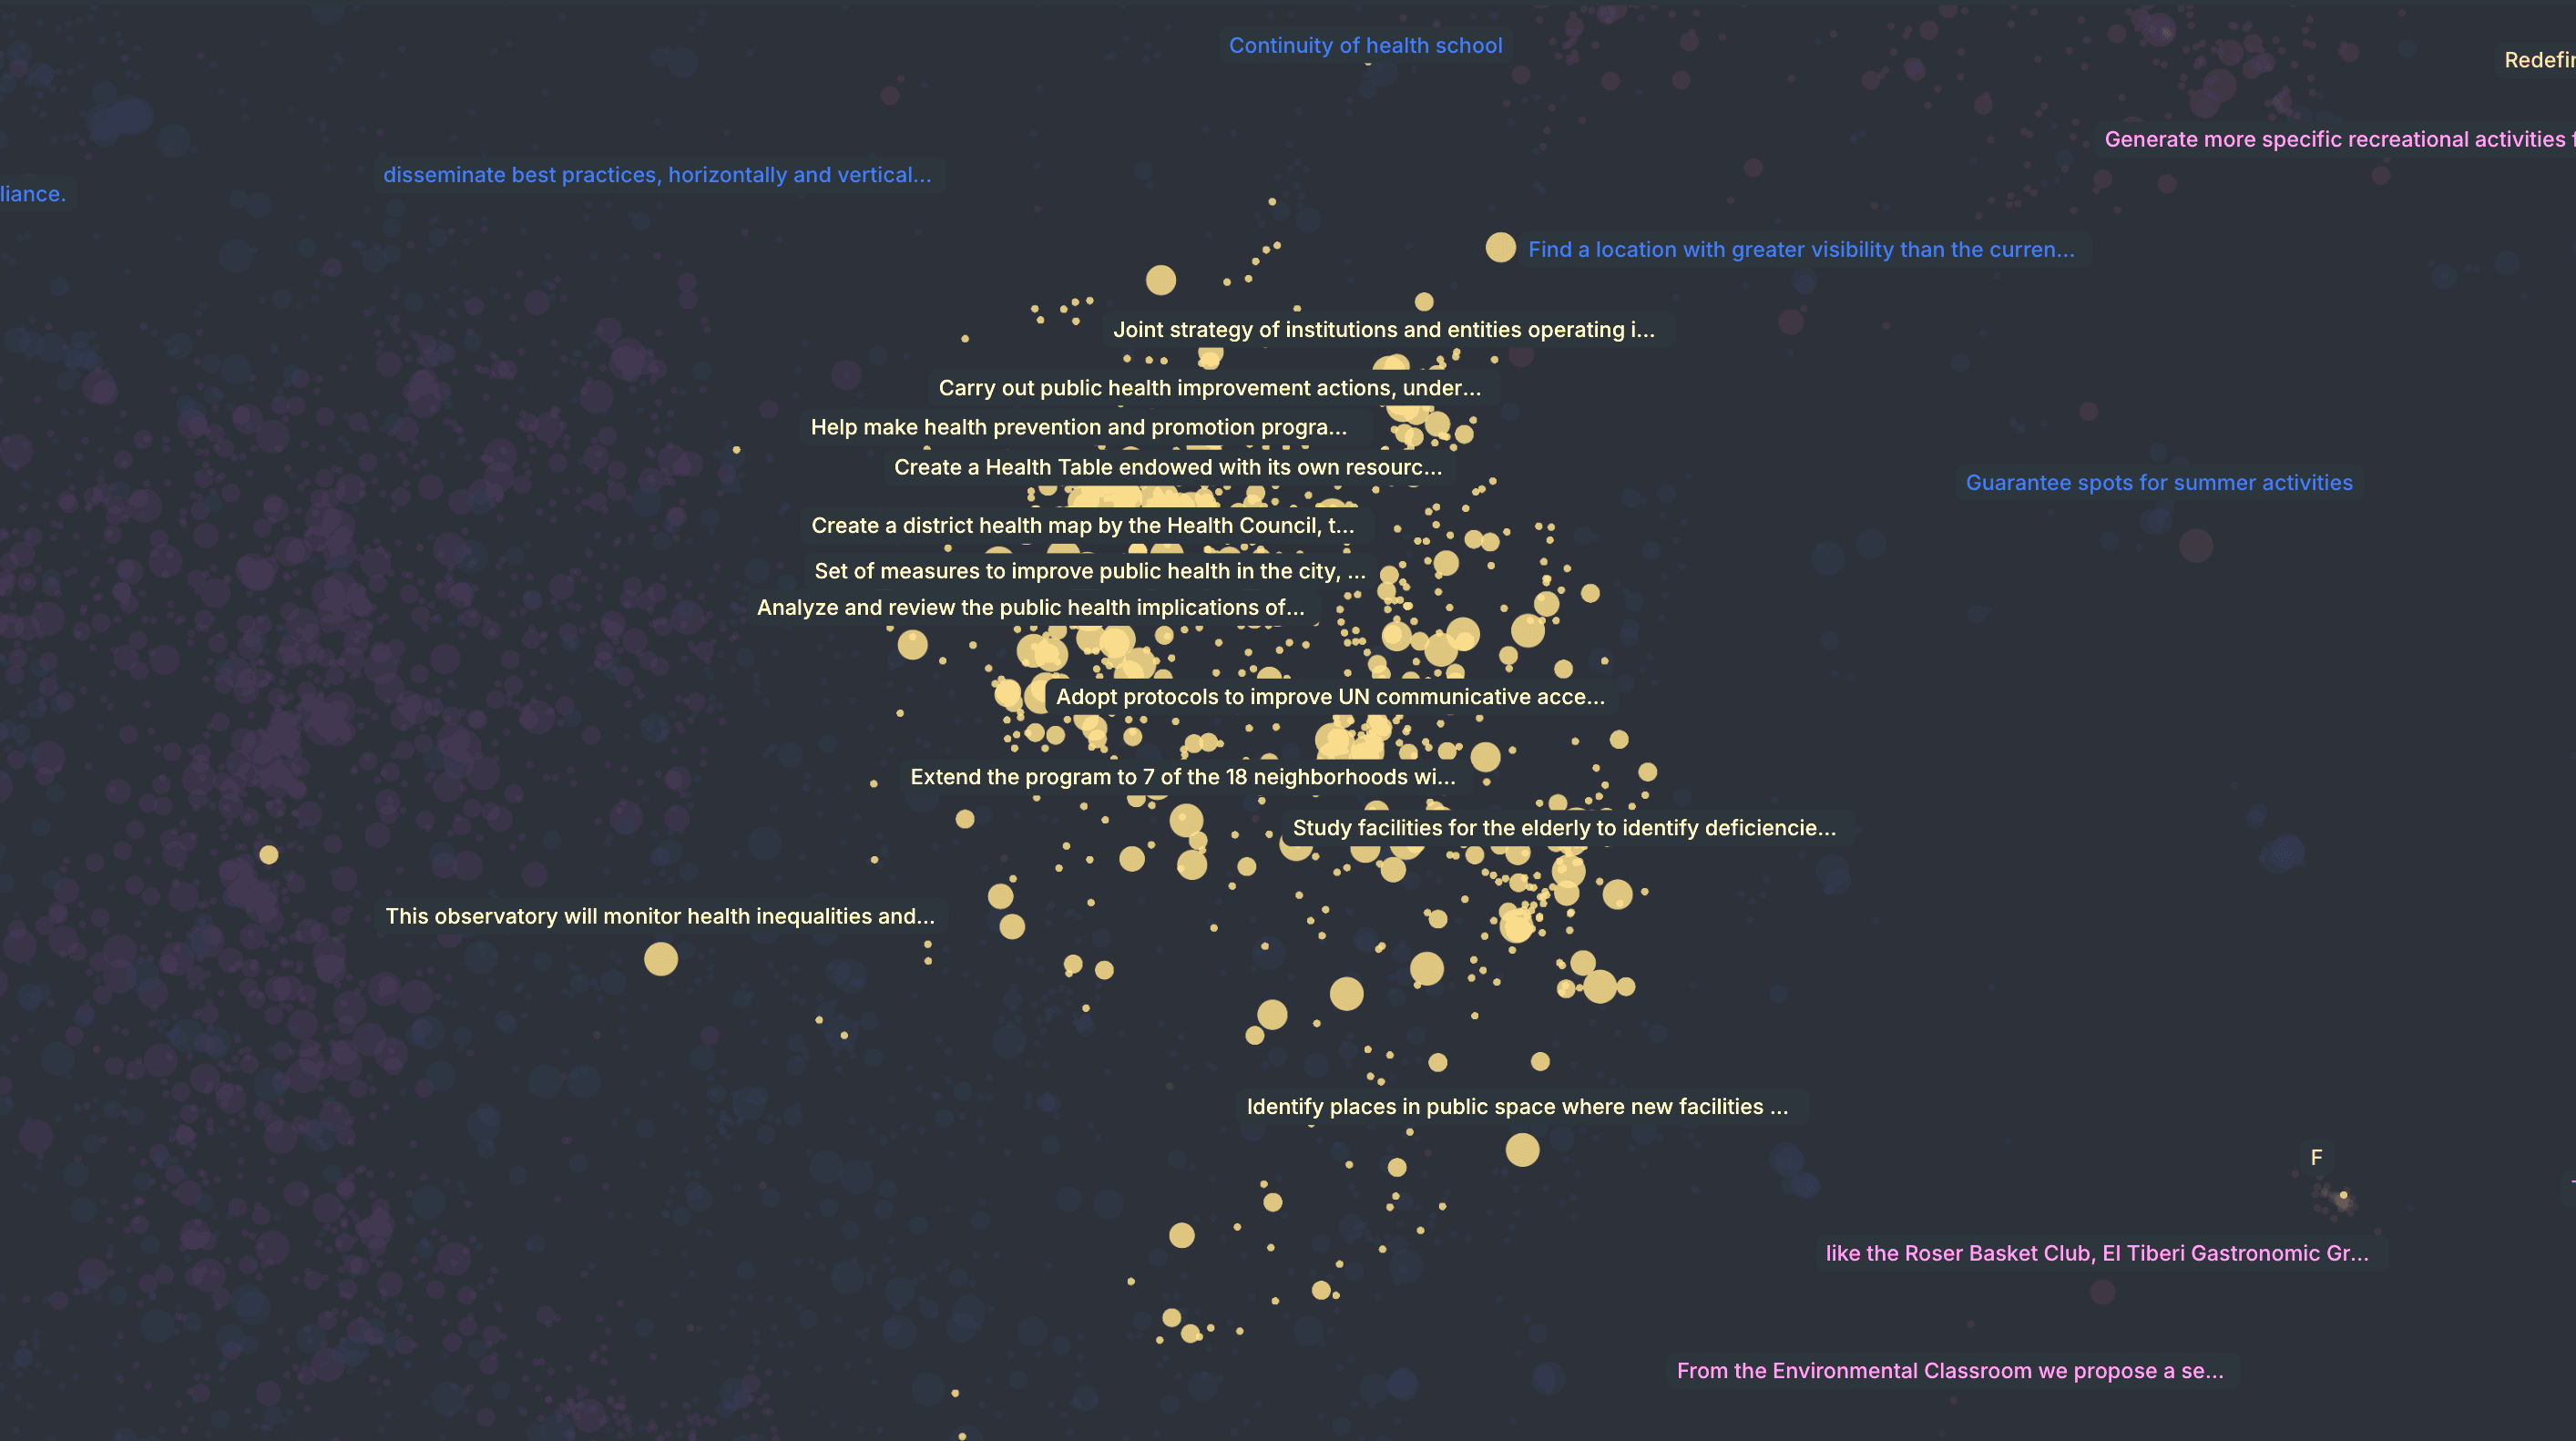
Barcelona City Proposals
Visualizing the most recurrent topics in more than 30K citizen proposals submitted to the participatory platform decidim.barcelona over an eight-year period. Created by Diego Arredondo.
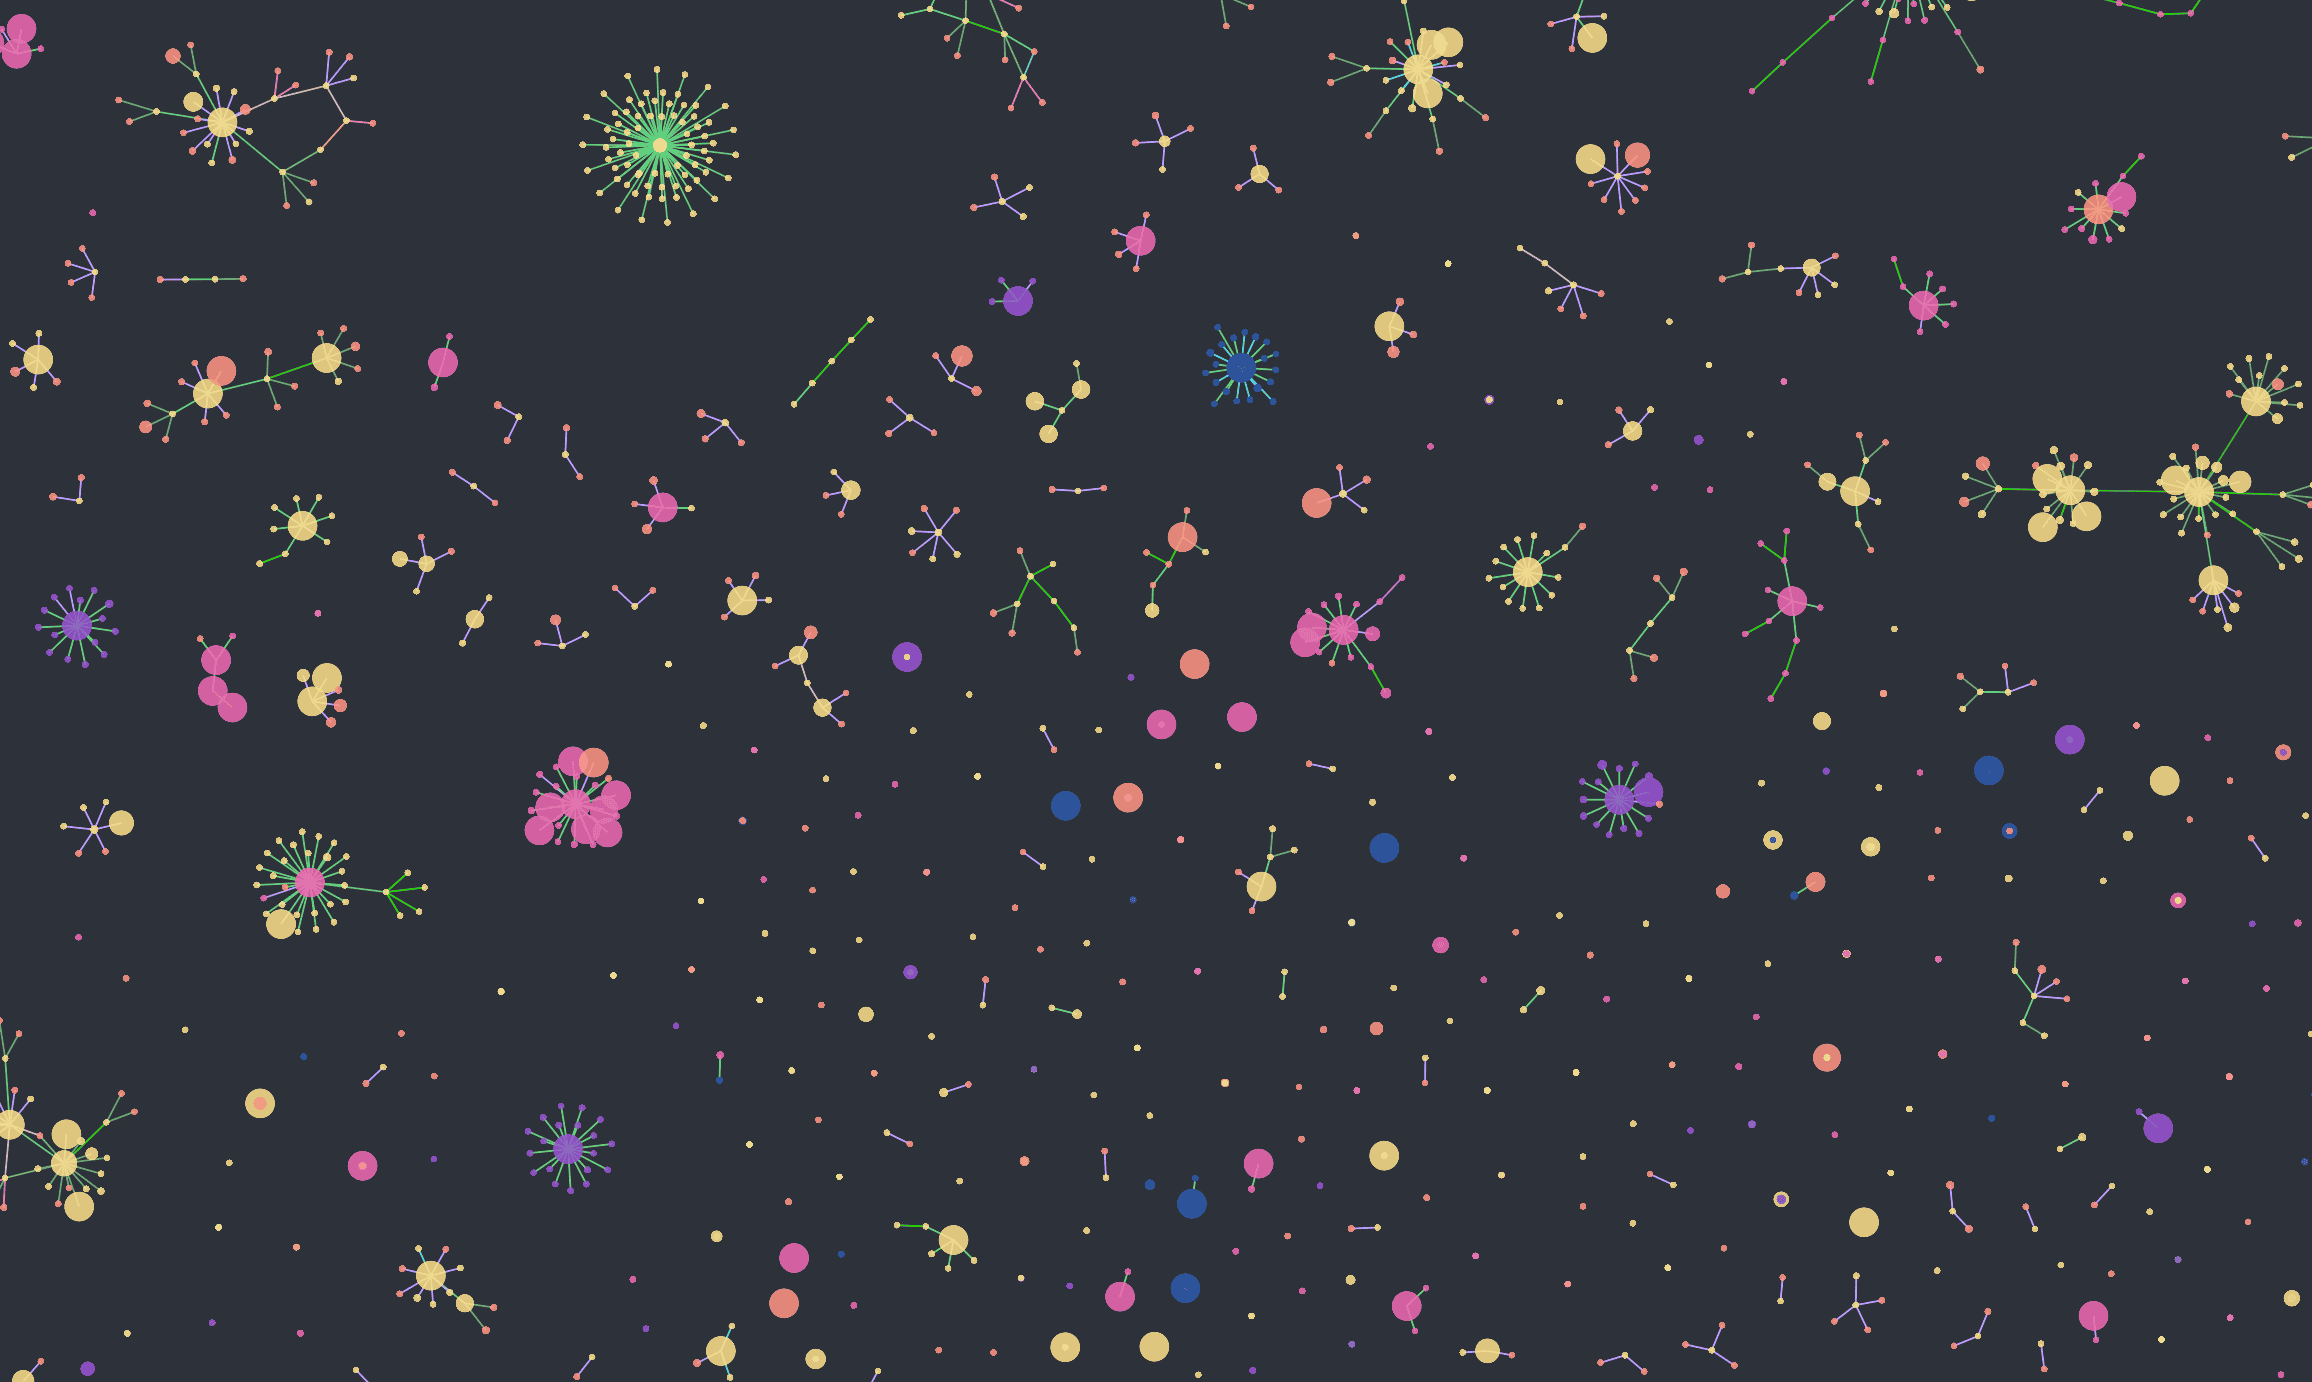
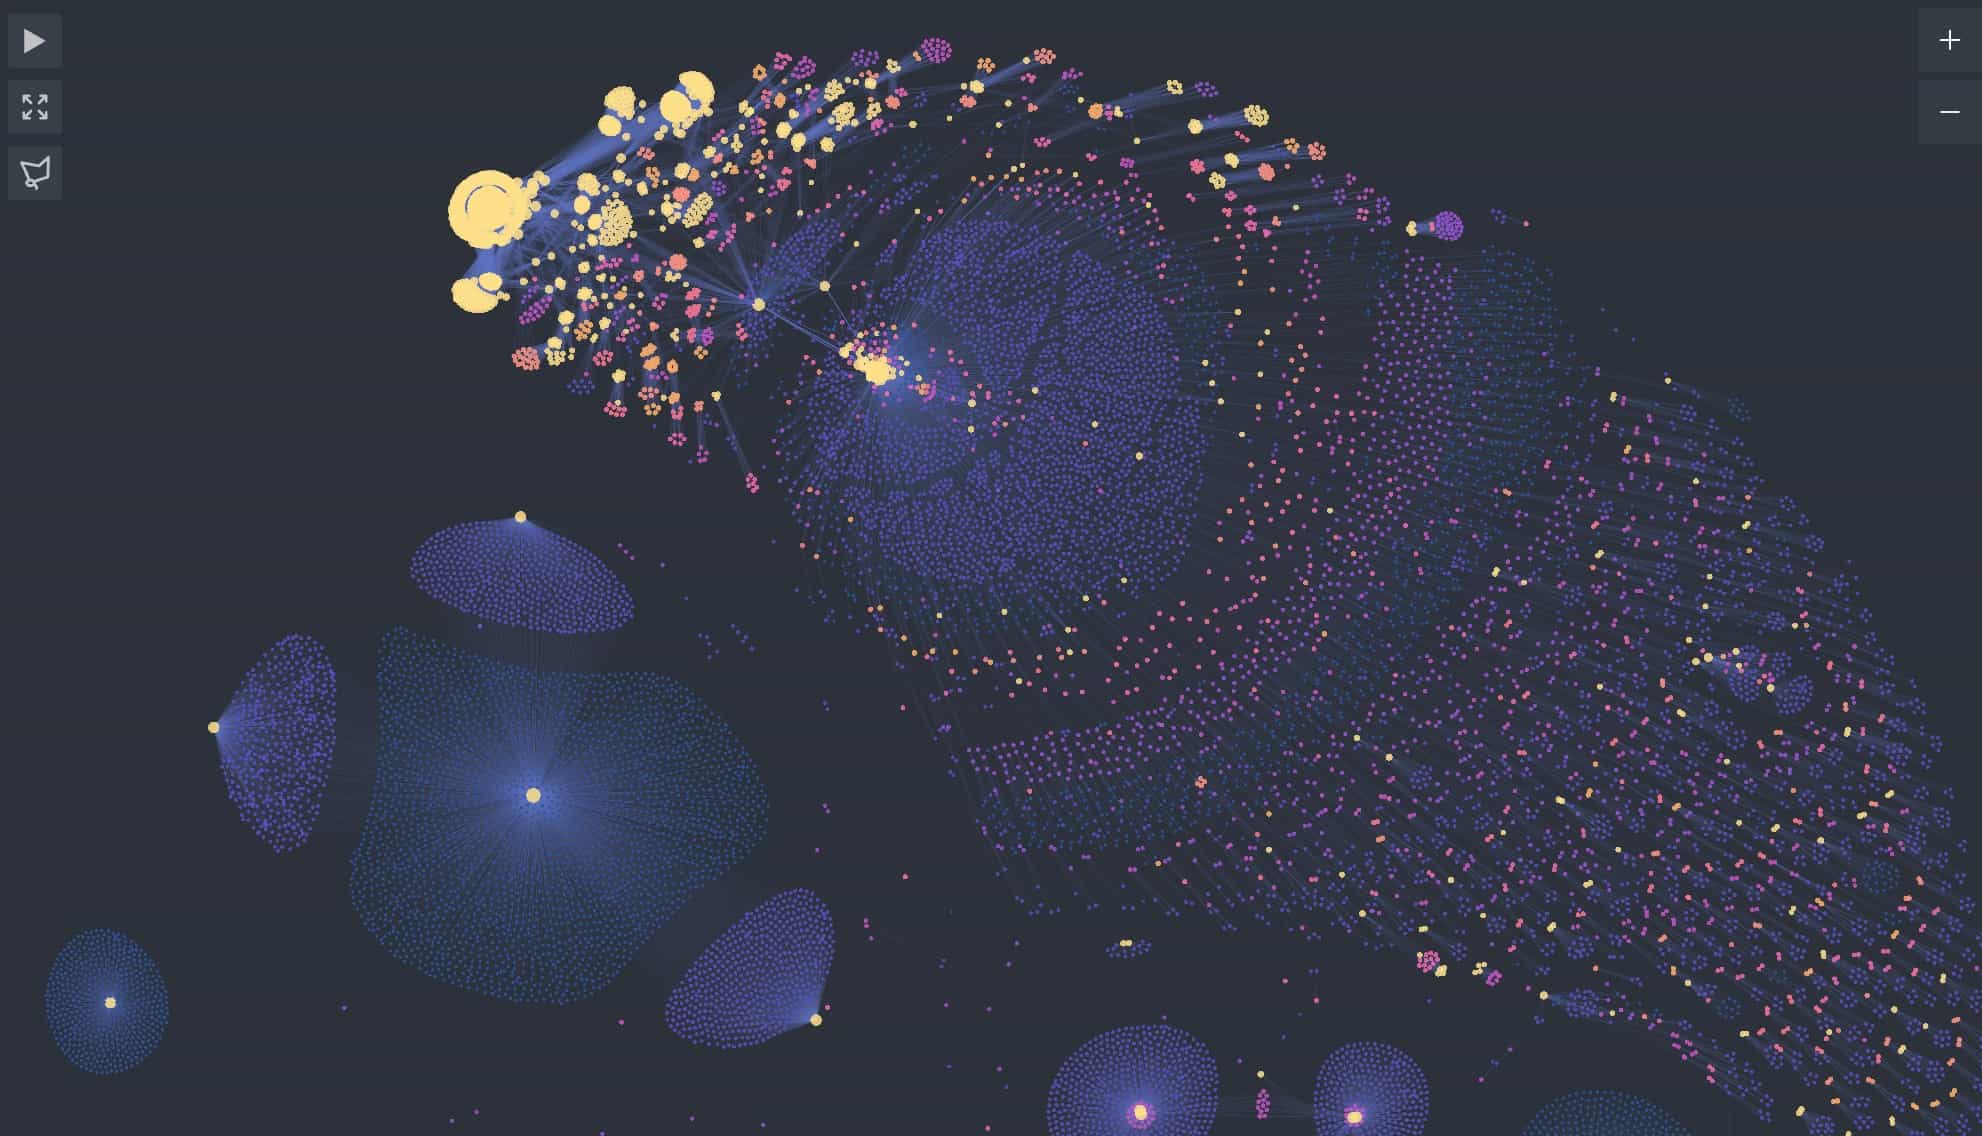
AI Model Atlas
Model Atlas visualizes entire populations of machine-learning models as an interconnected graph, showing how models evolve, relate, and transform through fine-tuning. Learn more at horwitz.ai/model-atlas.
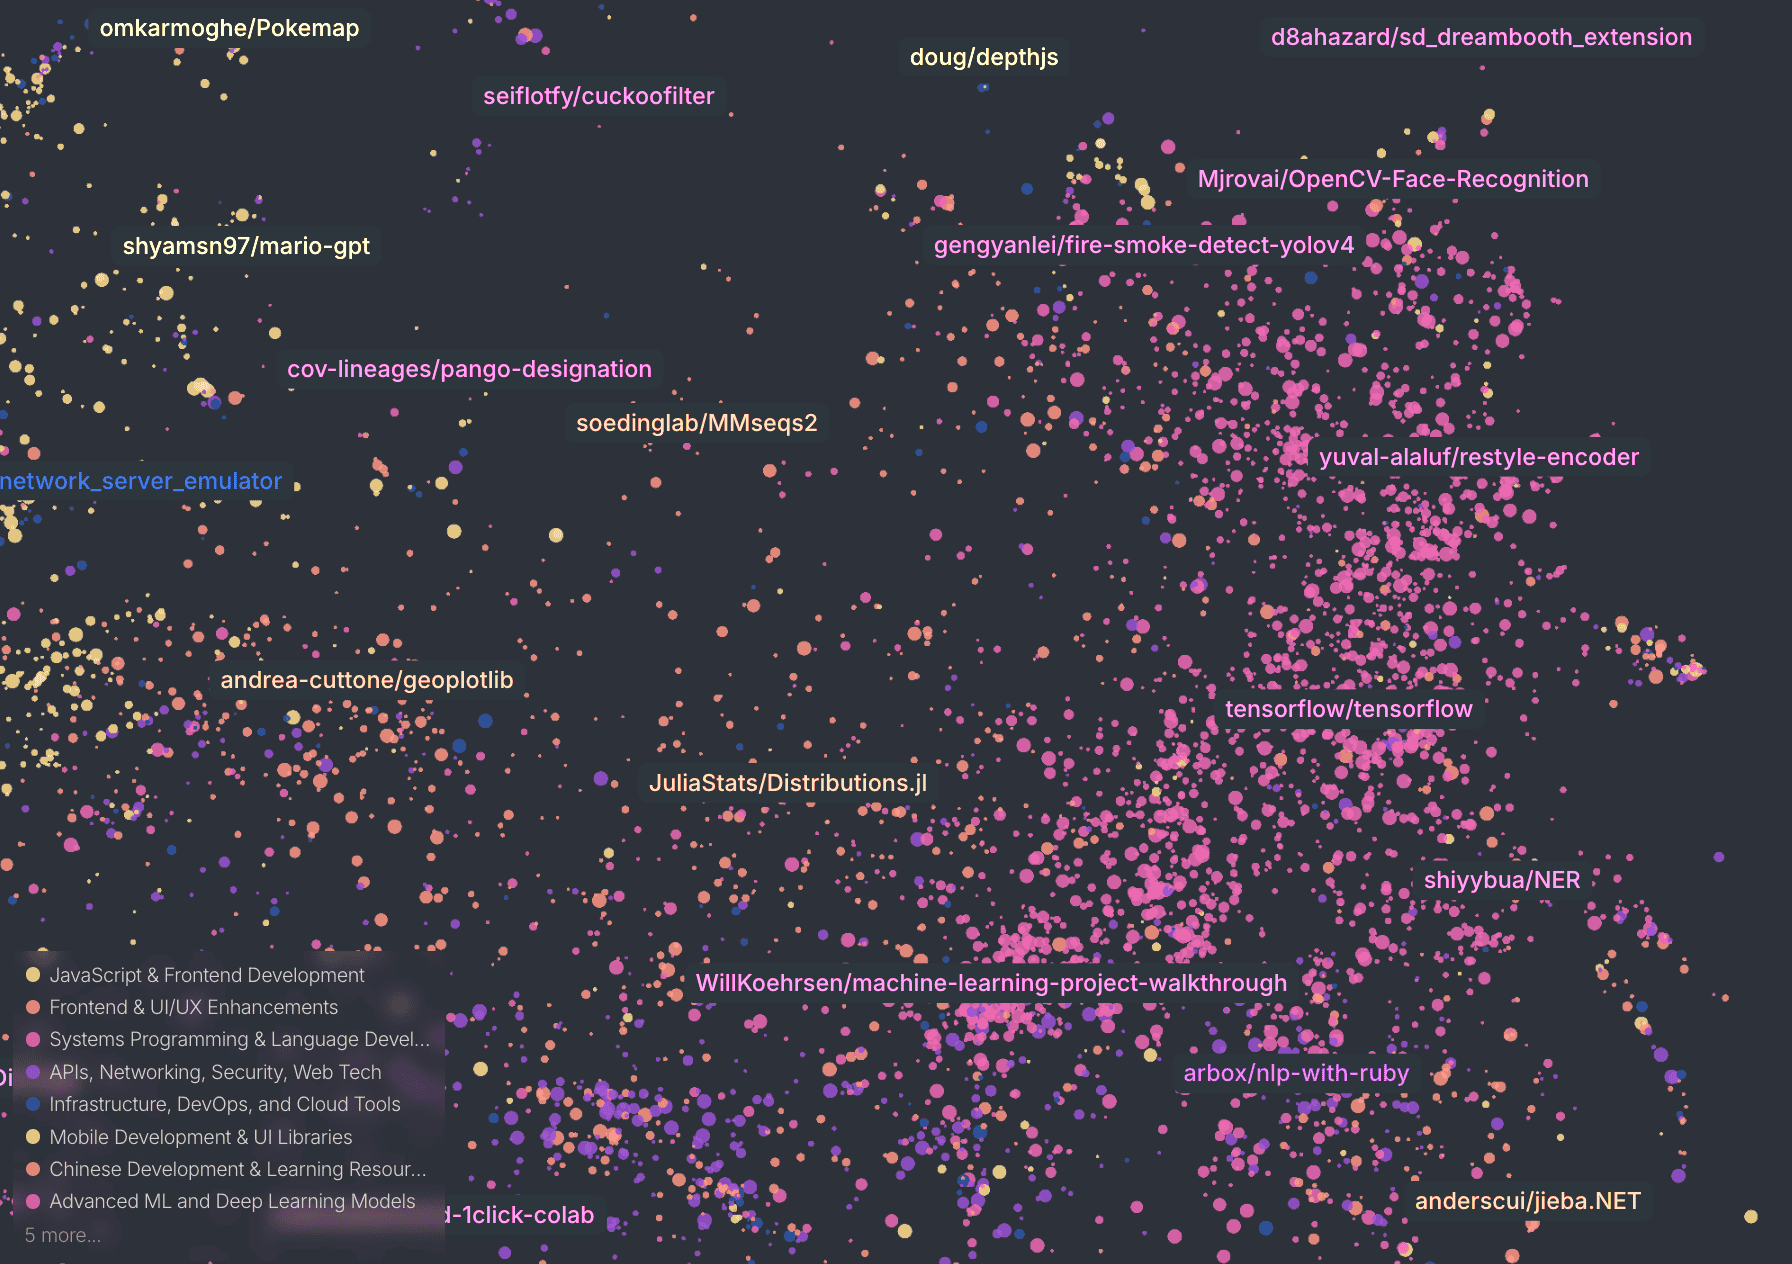
Map of GitHub
Semantic map of GitHub repositories. Each point represents a repository positioned by repo description.
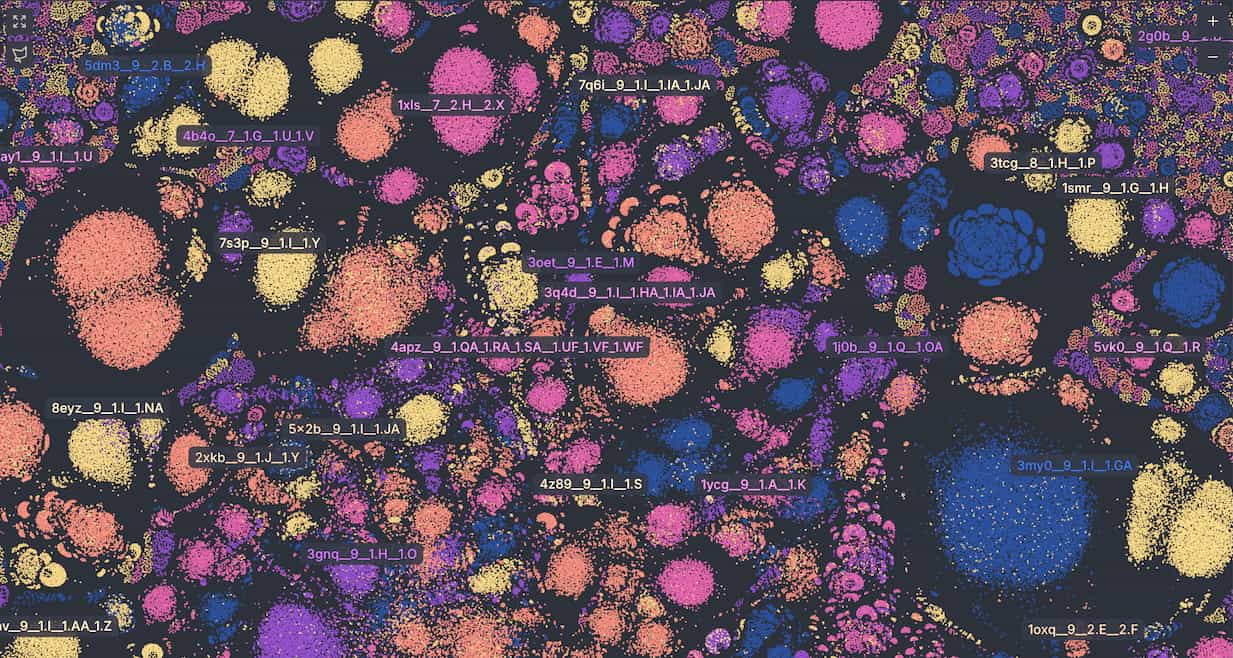
PLINDER
Interactive atlas of protein–ligand systems. Each point represents a Plinder system positioned by shared interaction patterns. Learn more at plinder.sh.
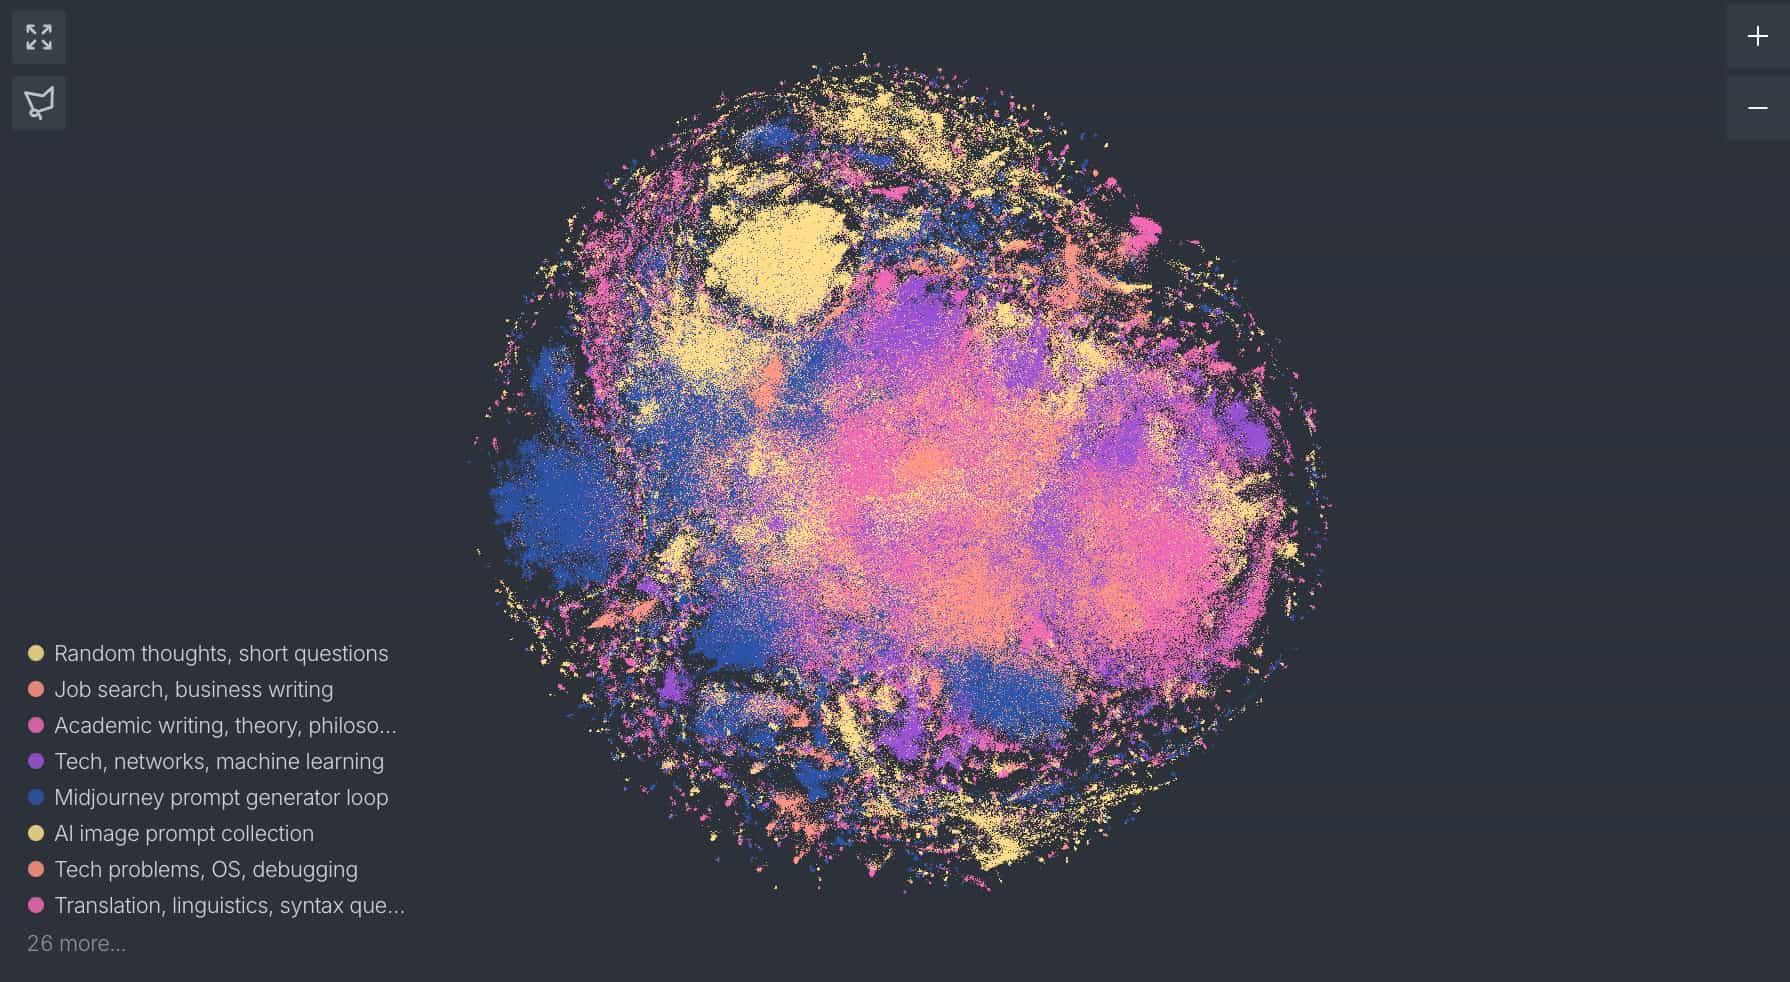
LLM & Human Conversations
One million real-world LLM conversations displayed on a massive temporal graph. Identify common topics, anomalies, and how they change over time.
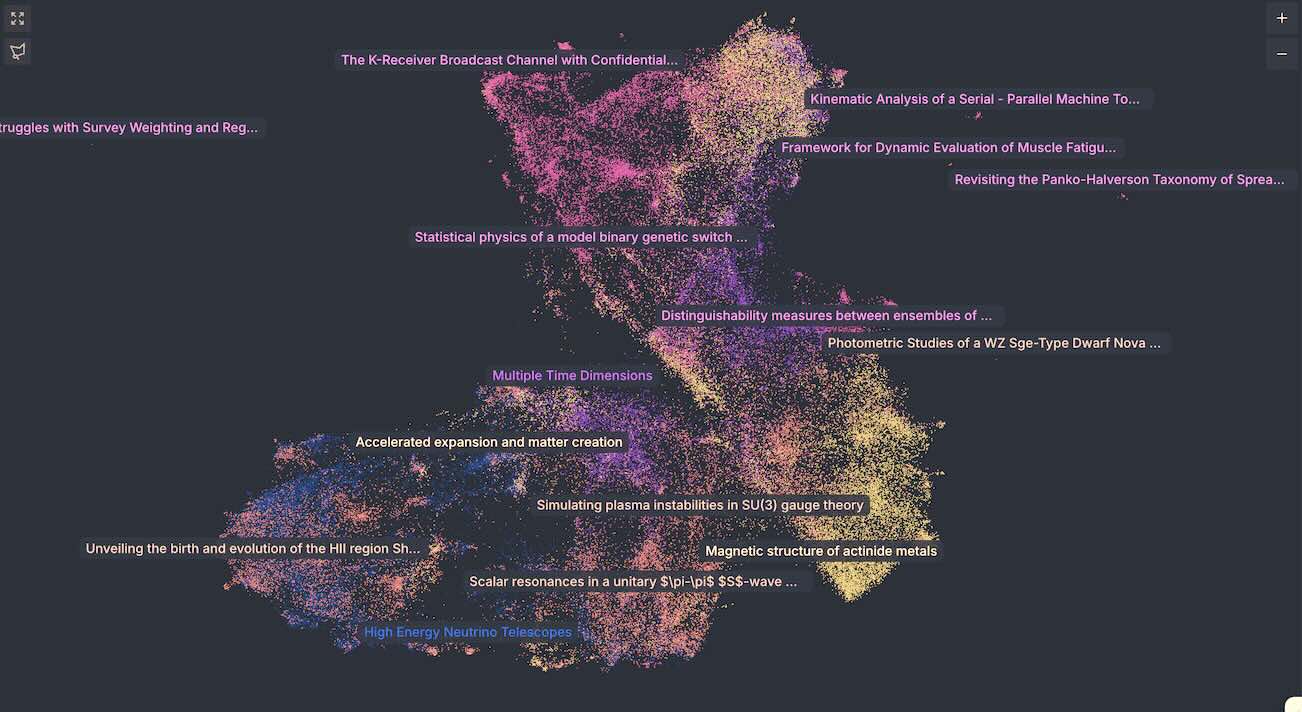
Knowledge Graphs
A semantic map of 100,000 papers from arXiv.org. Identify the major research areas and emerging topics.
Anomalies in Financial Transactions
Silk Road was the first modern darknet market and stood out as one of the most iconic cases in blockchain history. Try to identify anomalies in Silk Road crypto transactions with Cosmograph.
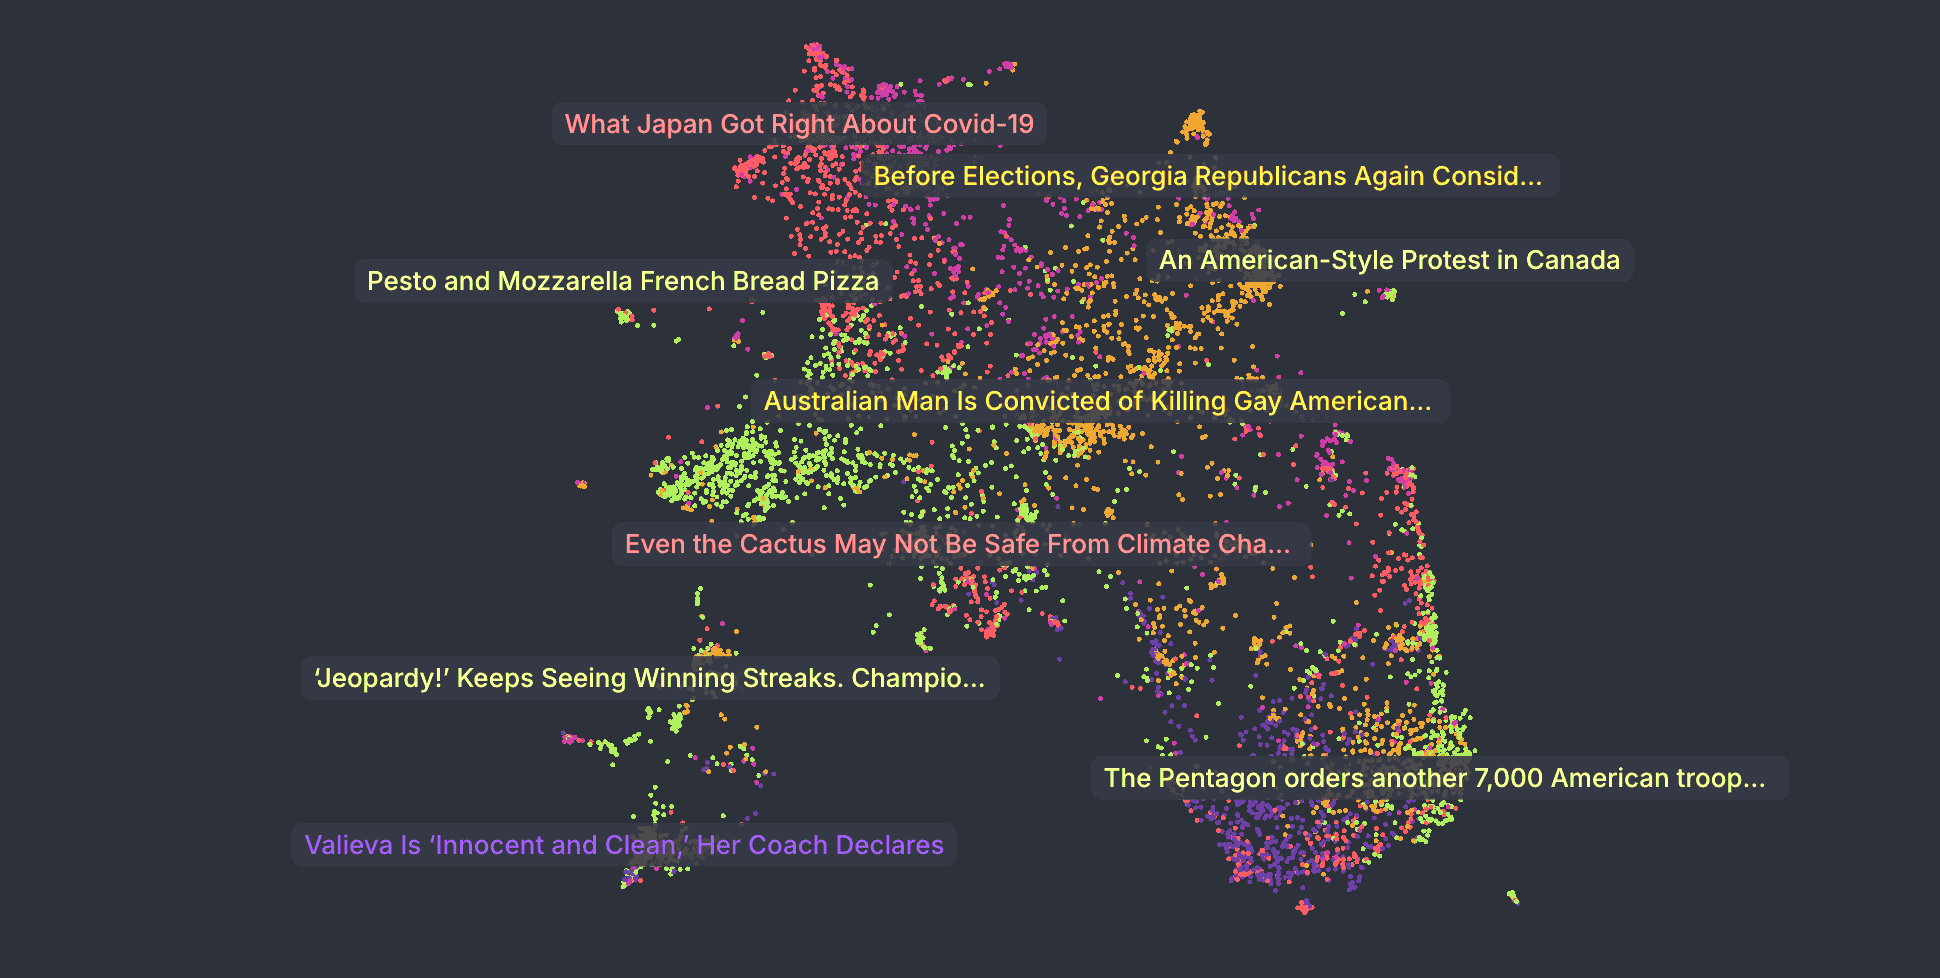
Textual Datasets
Explore around 7,000 articles from The New York Times published between January 2022 and April 2022.
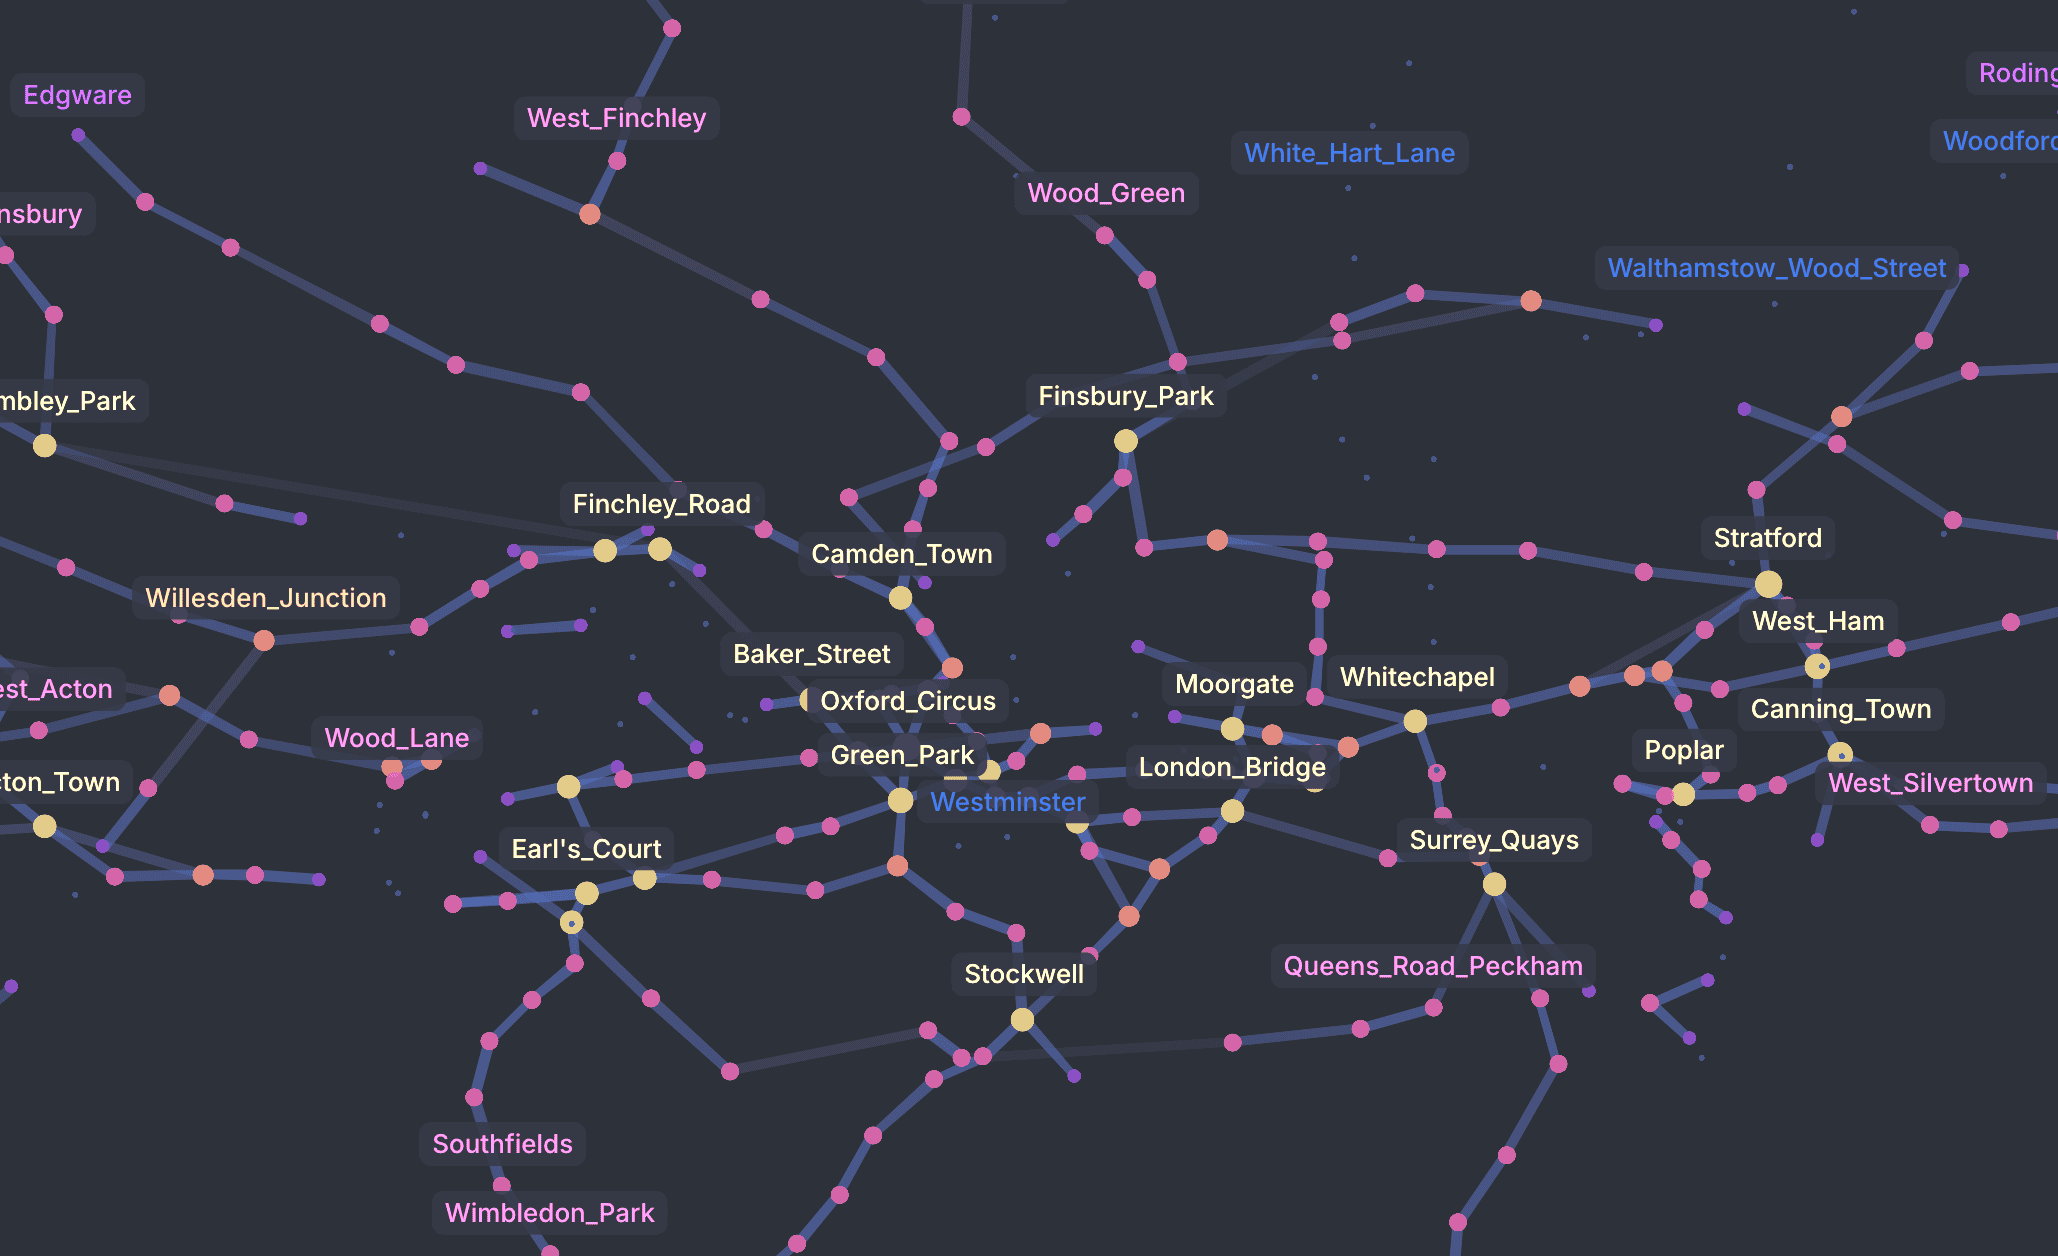
Geospatial Networks
London Tube map with stations and lines.