Introduction

Welcome to the world of Cosmograph! This documentation will guide you through getting started with a lightning-fast library for visualizing large network graphs.

info

If you're planning to use this software in your work, follow the Citing and licensing section.

πŸ’» Web application​

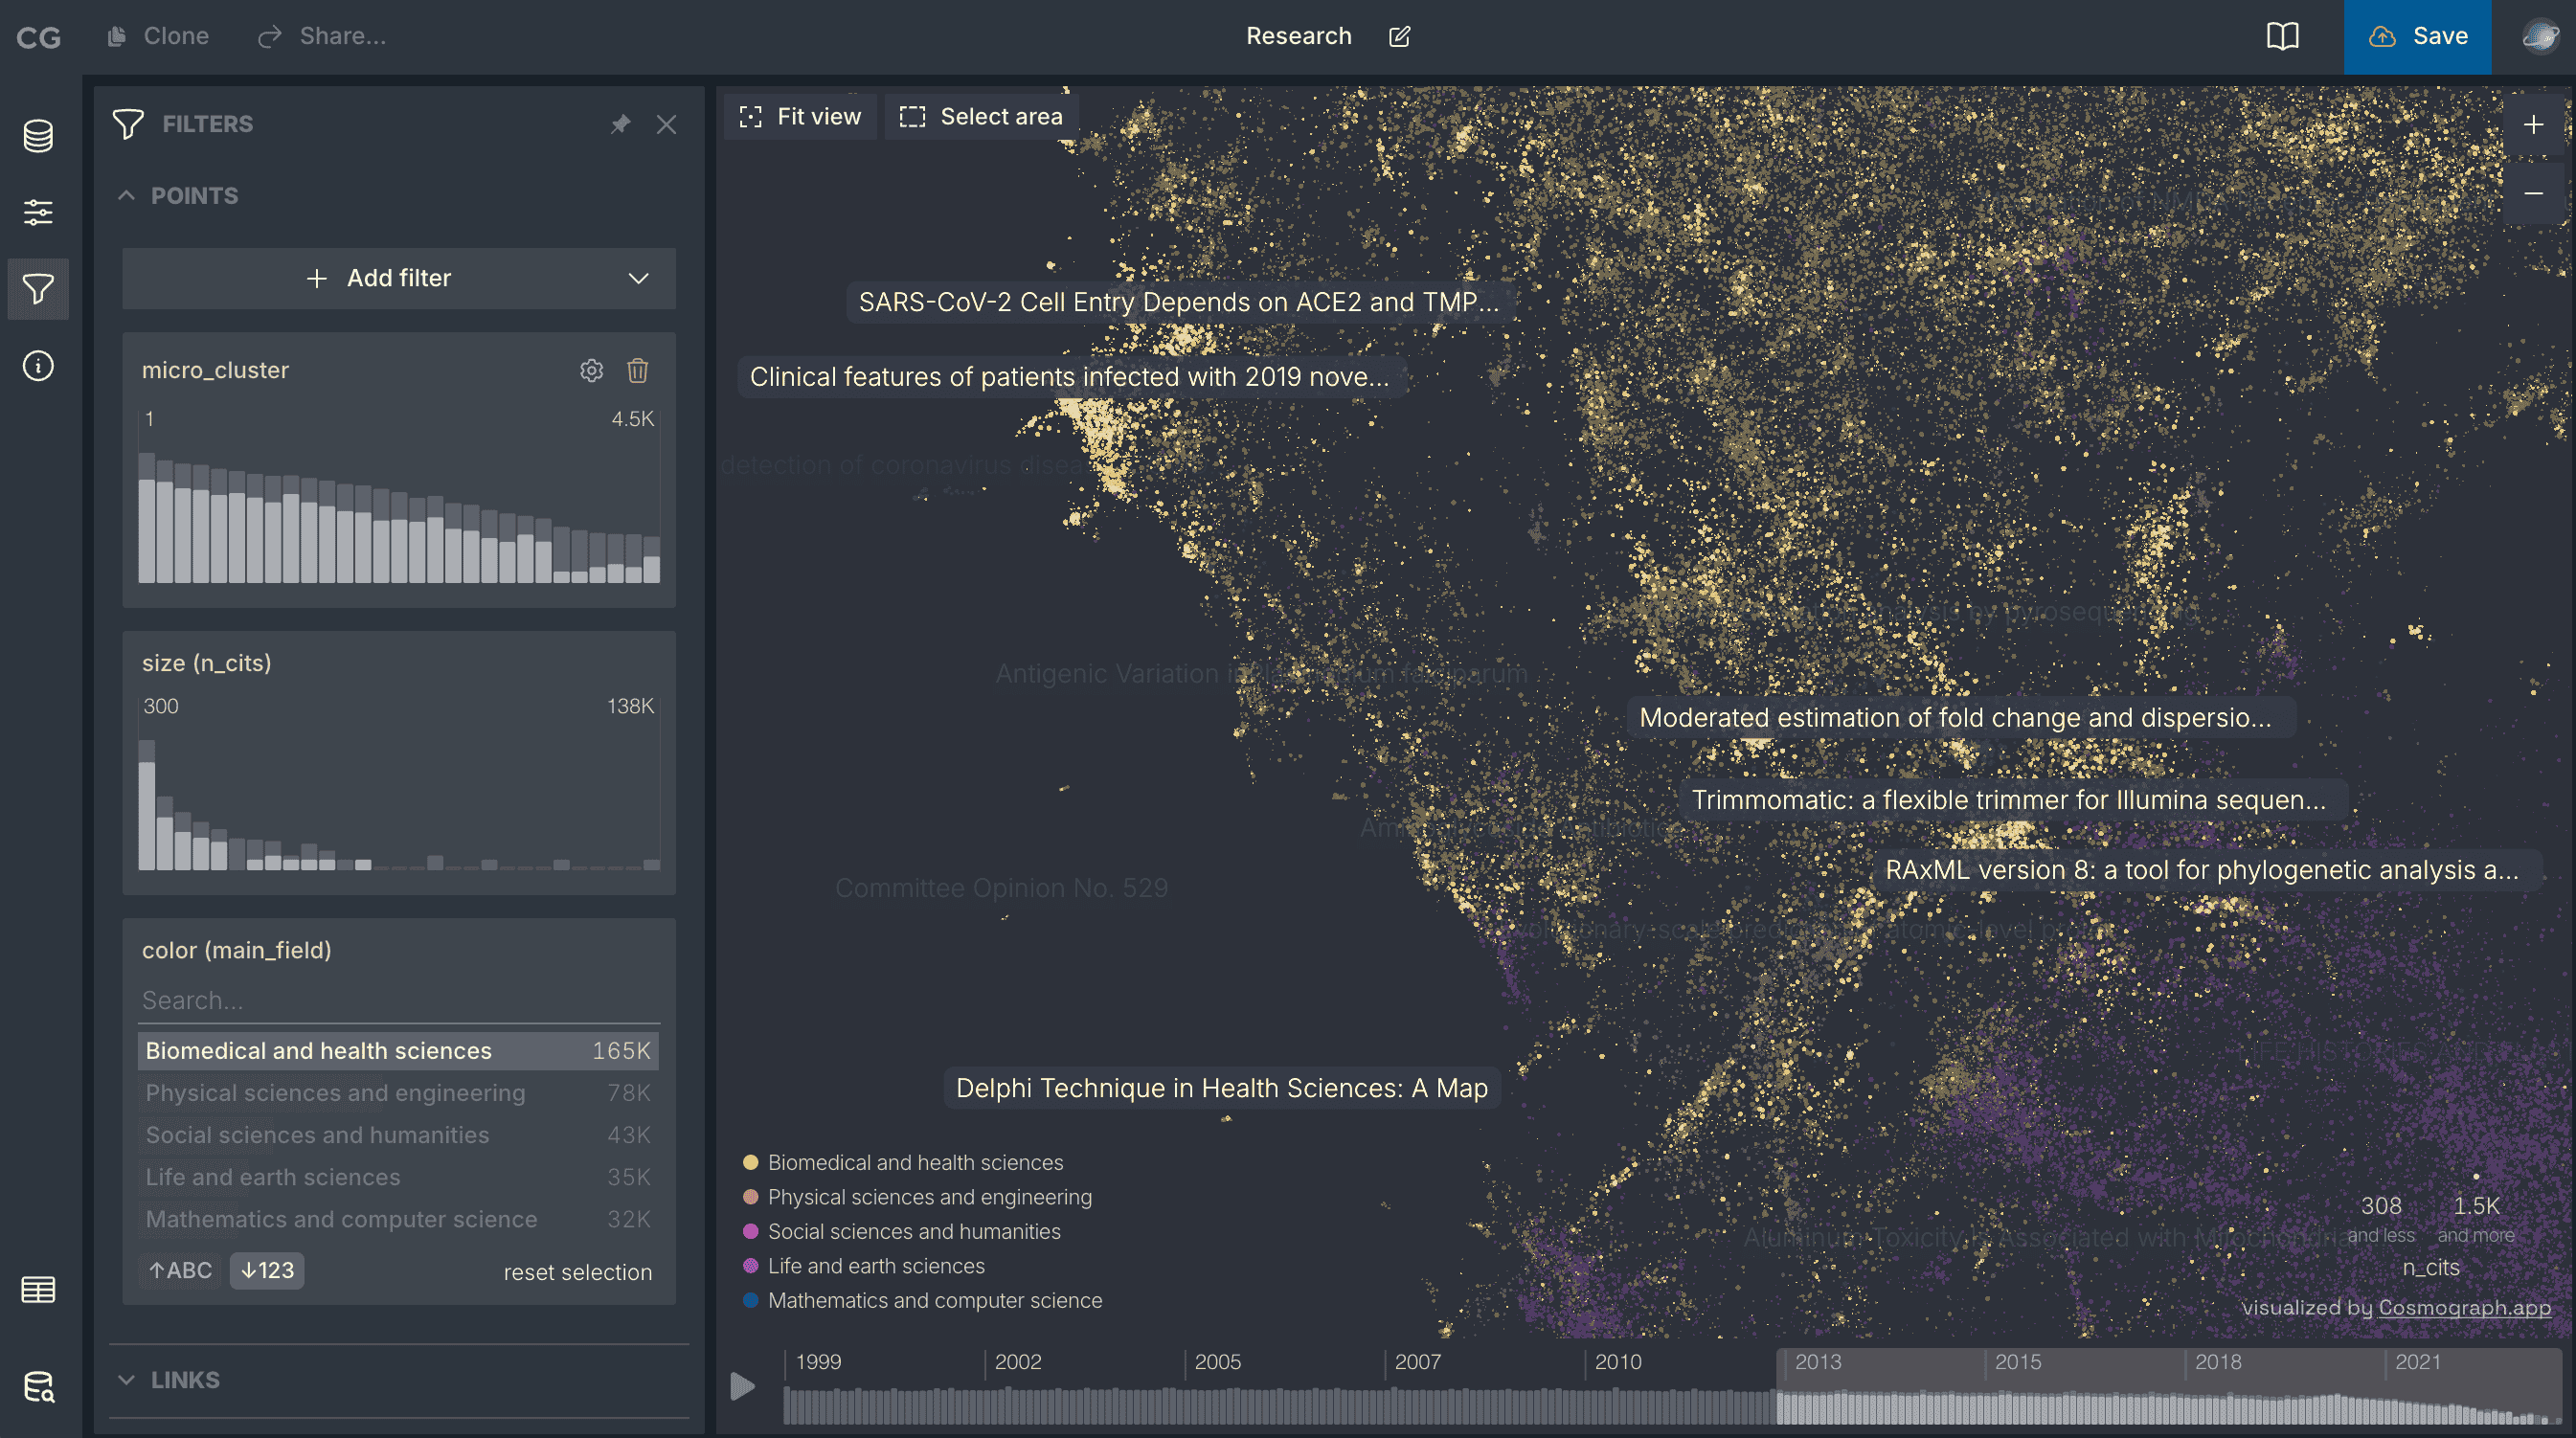
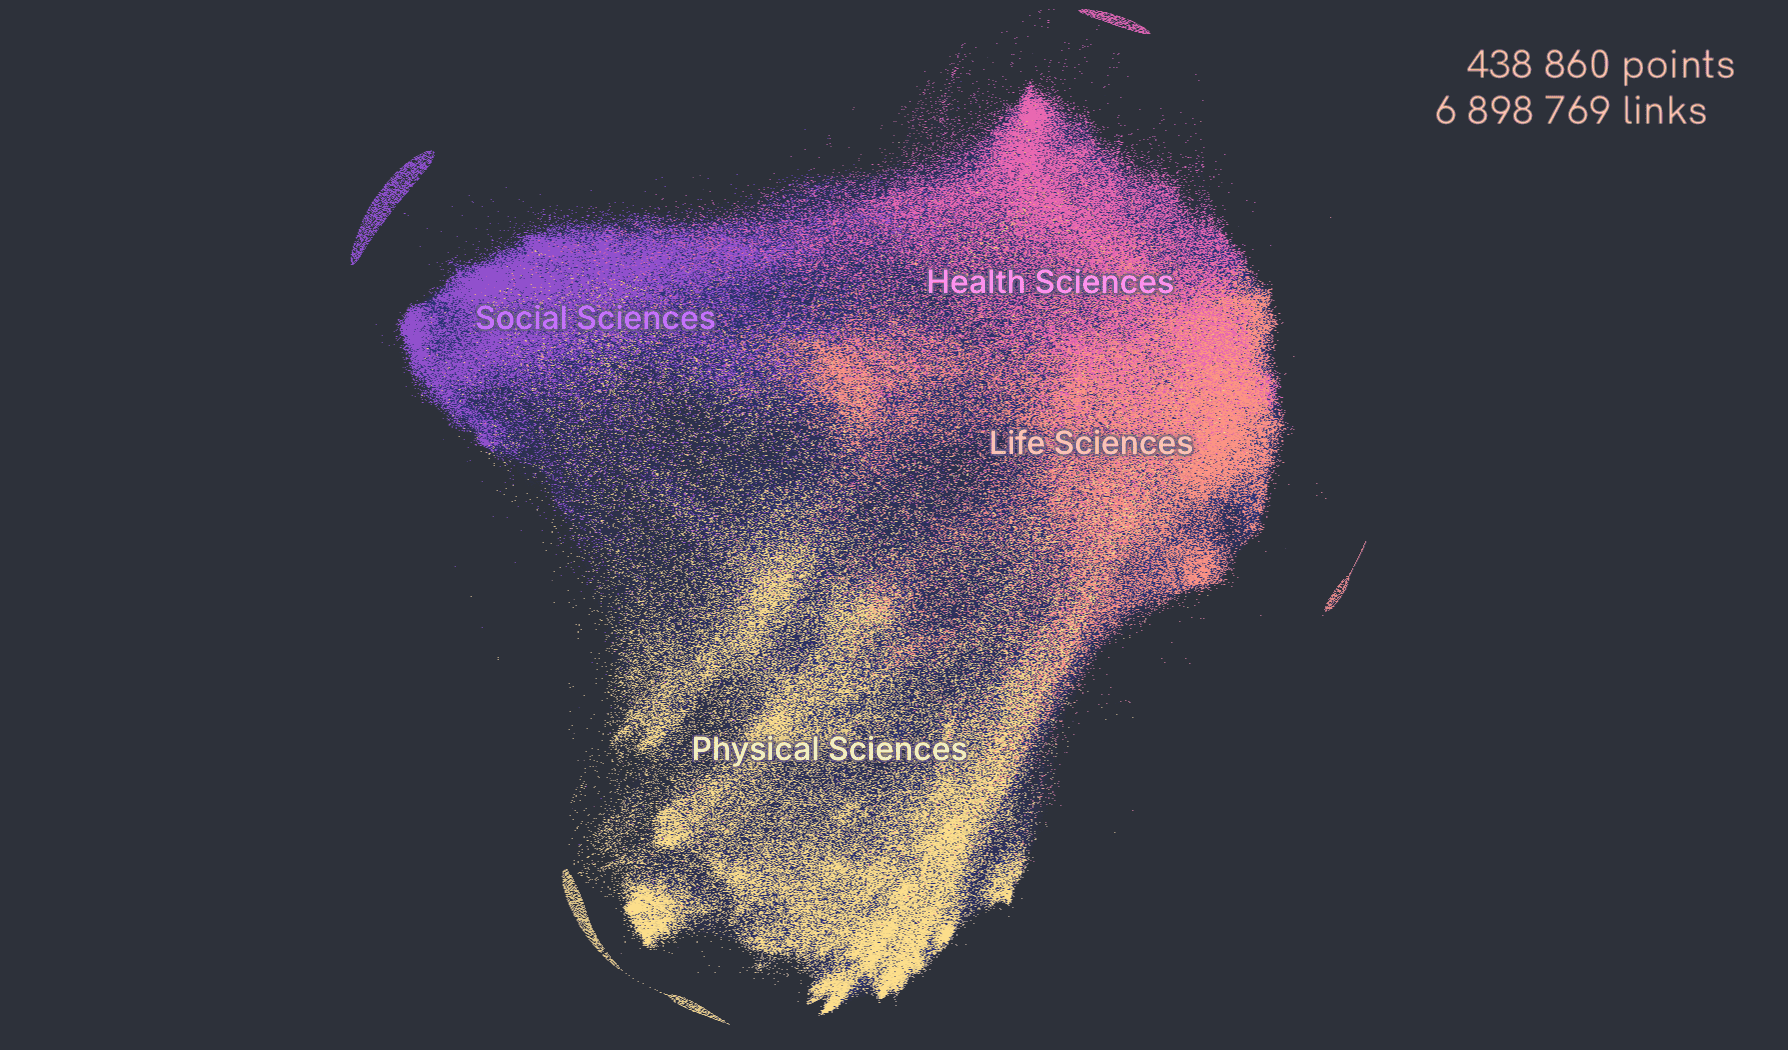
Explore the power of Cosmograph web application that enables you to analyze massive graph datasets and machine learning embeddings. Your data stays secure as all calculations are performed directly on your GPU.

To quickly visualize a network graph using the web application, refer to the How to use guide.

πŸ“š JavaScript/React library​

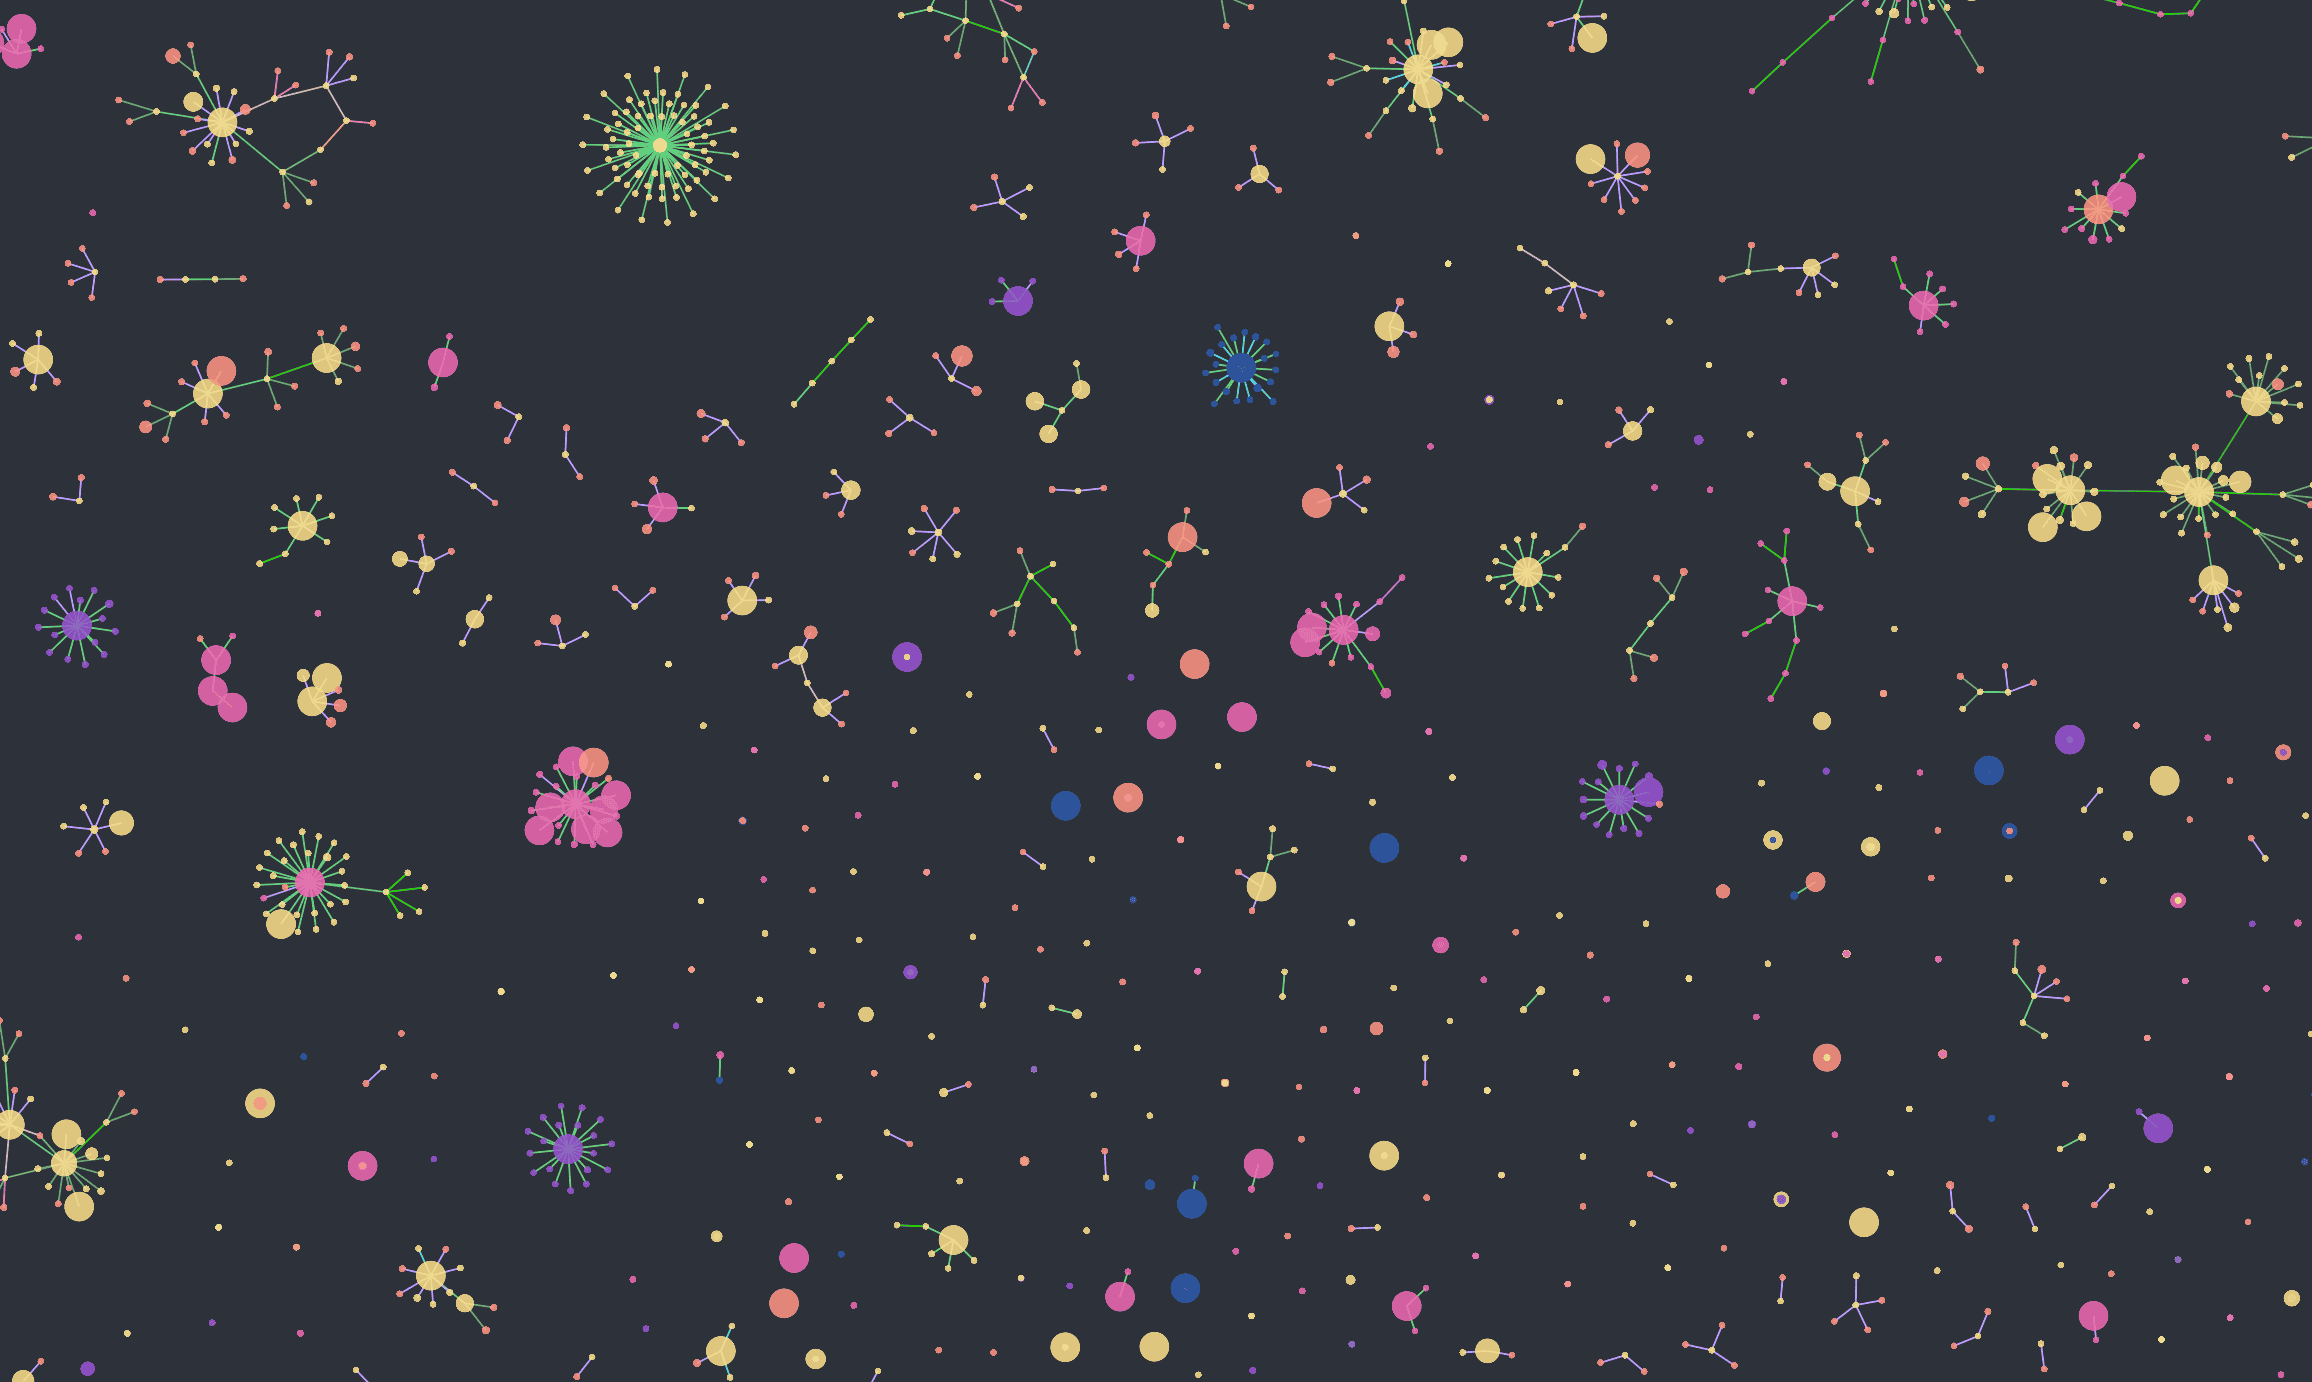
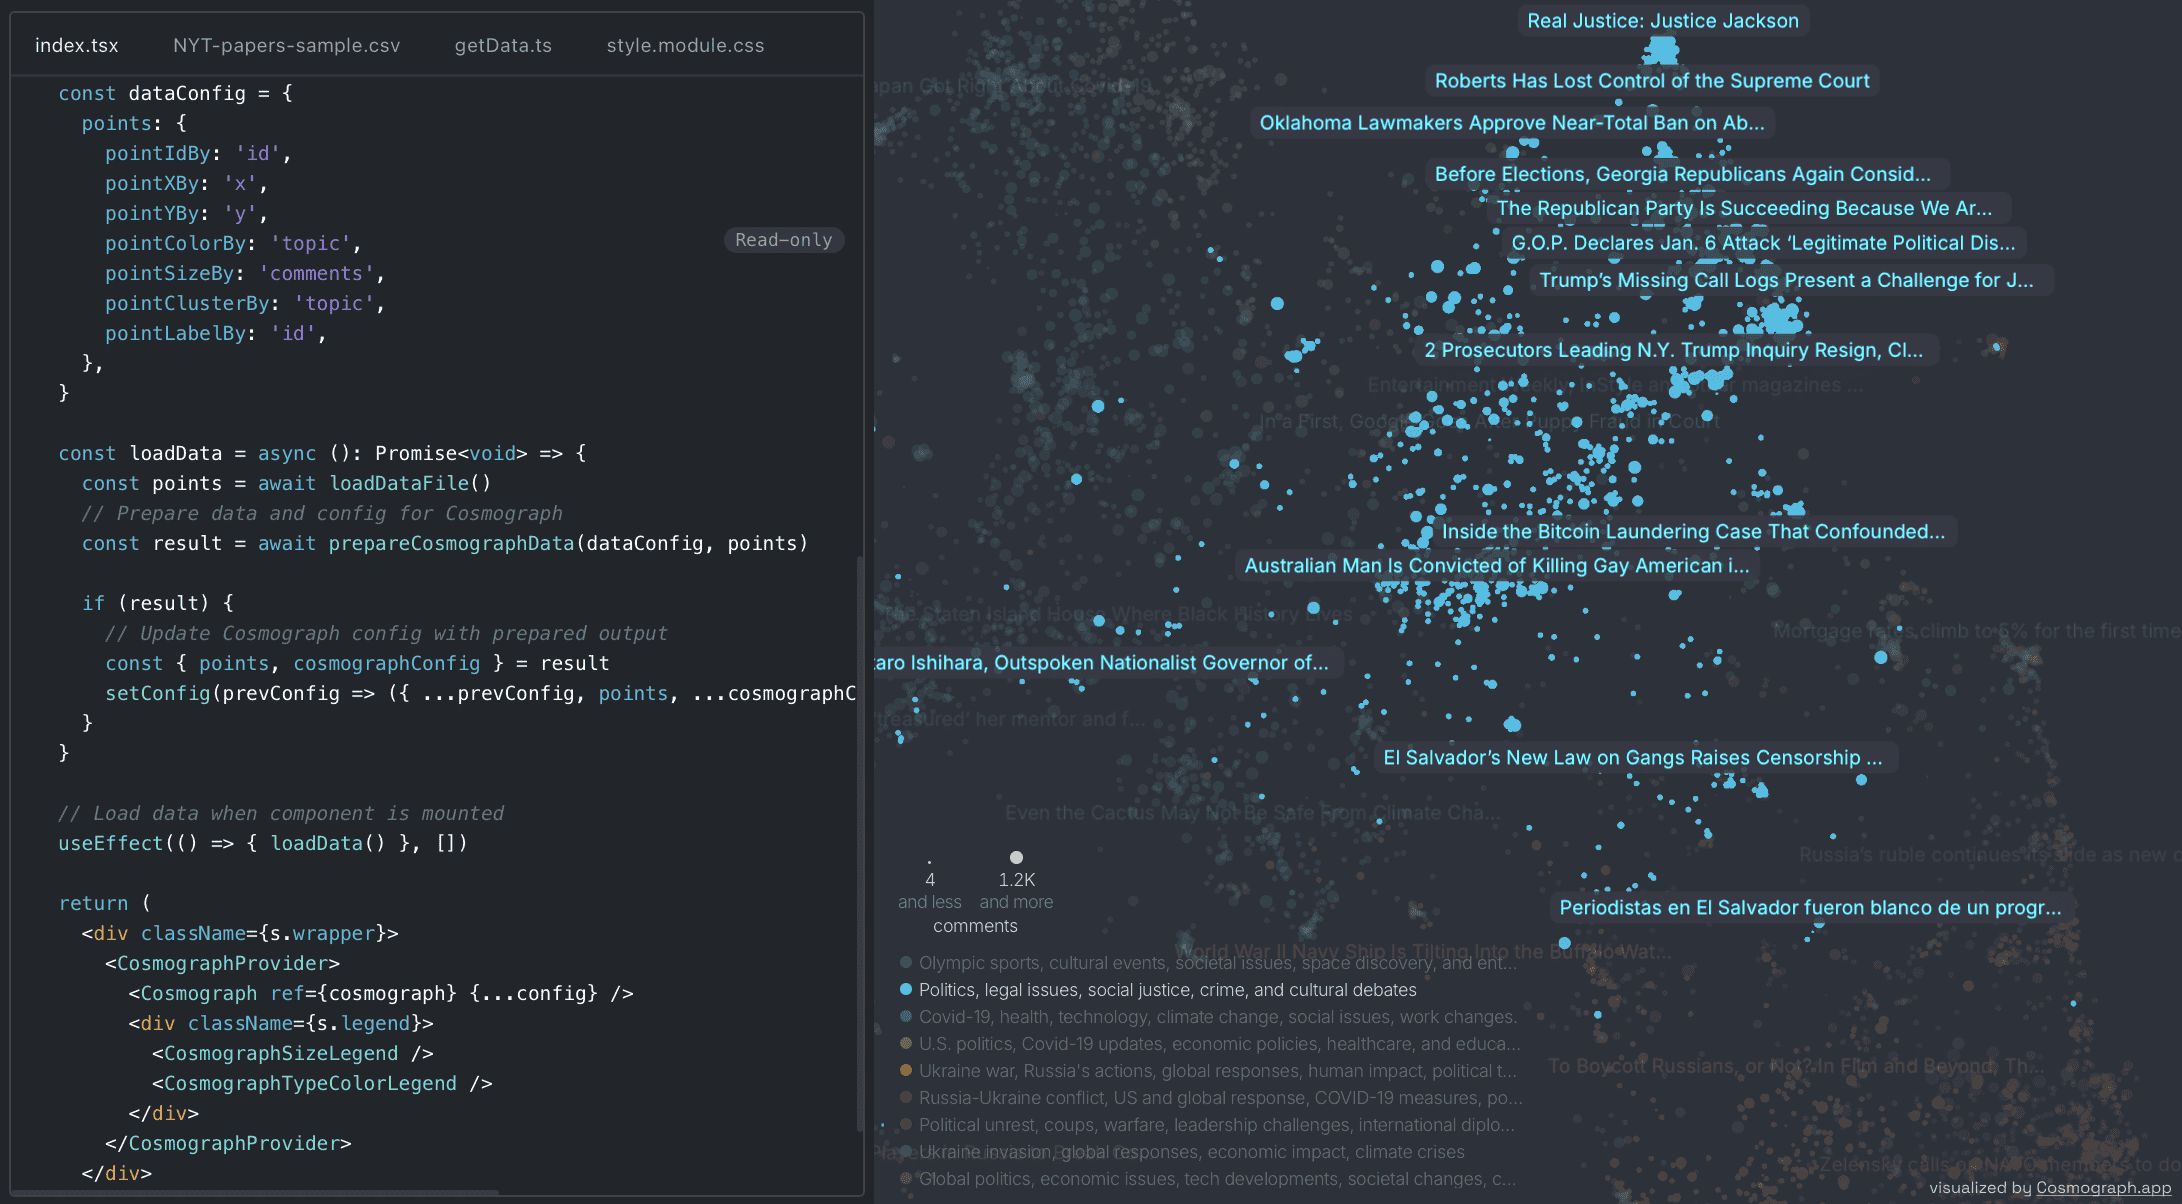
The fastest web-based library for large network graph visualization built on top of WebGL. You can use it to add blazingly fast network graph and embeddings visualizations to your own web application, and amplify them with extra components like Timeline, Histogram, Search, and more.

Go to the Get started section of the documentation to learn how to quickly visualize a network graph using React or plain TypeScript/JavaScript.


Discover Cosmograph's magic

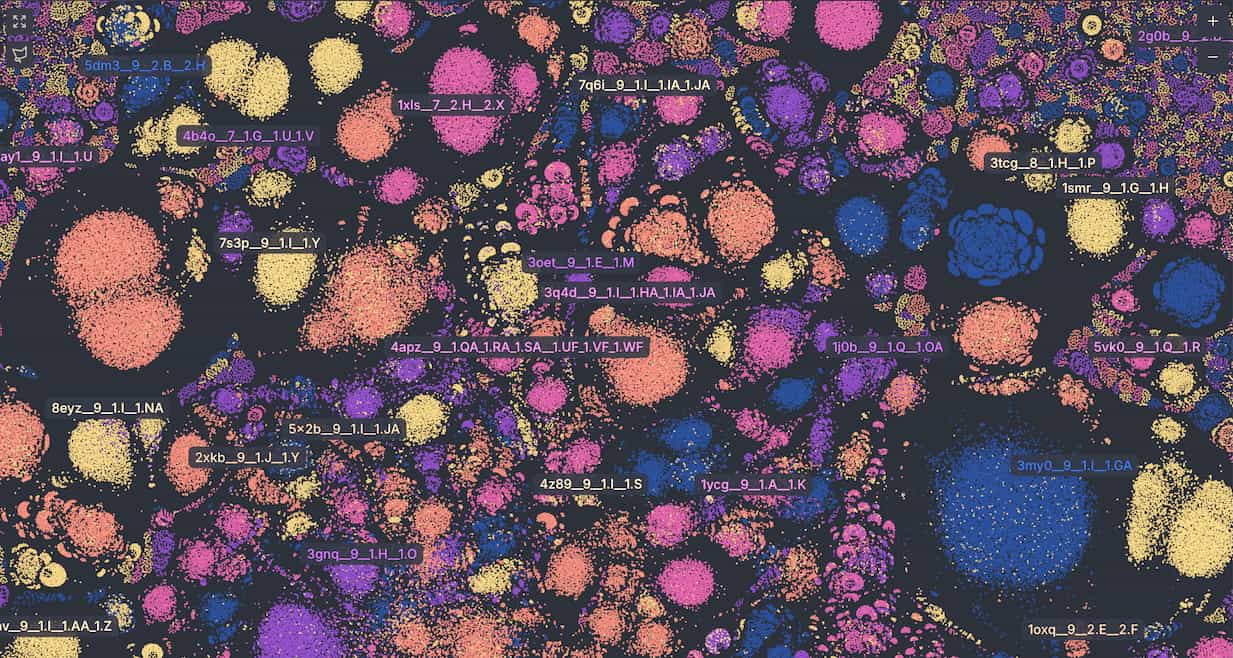
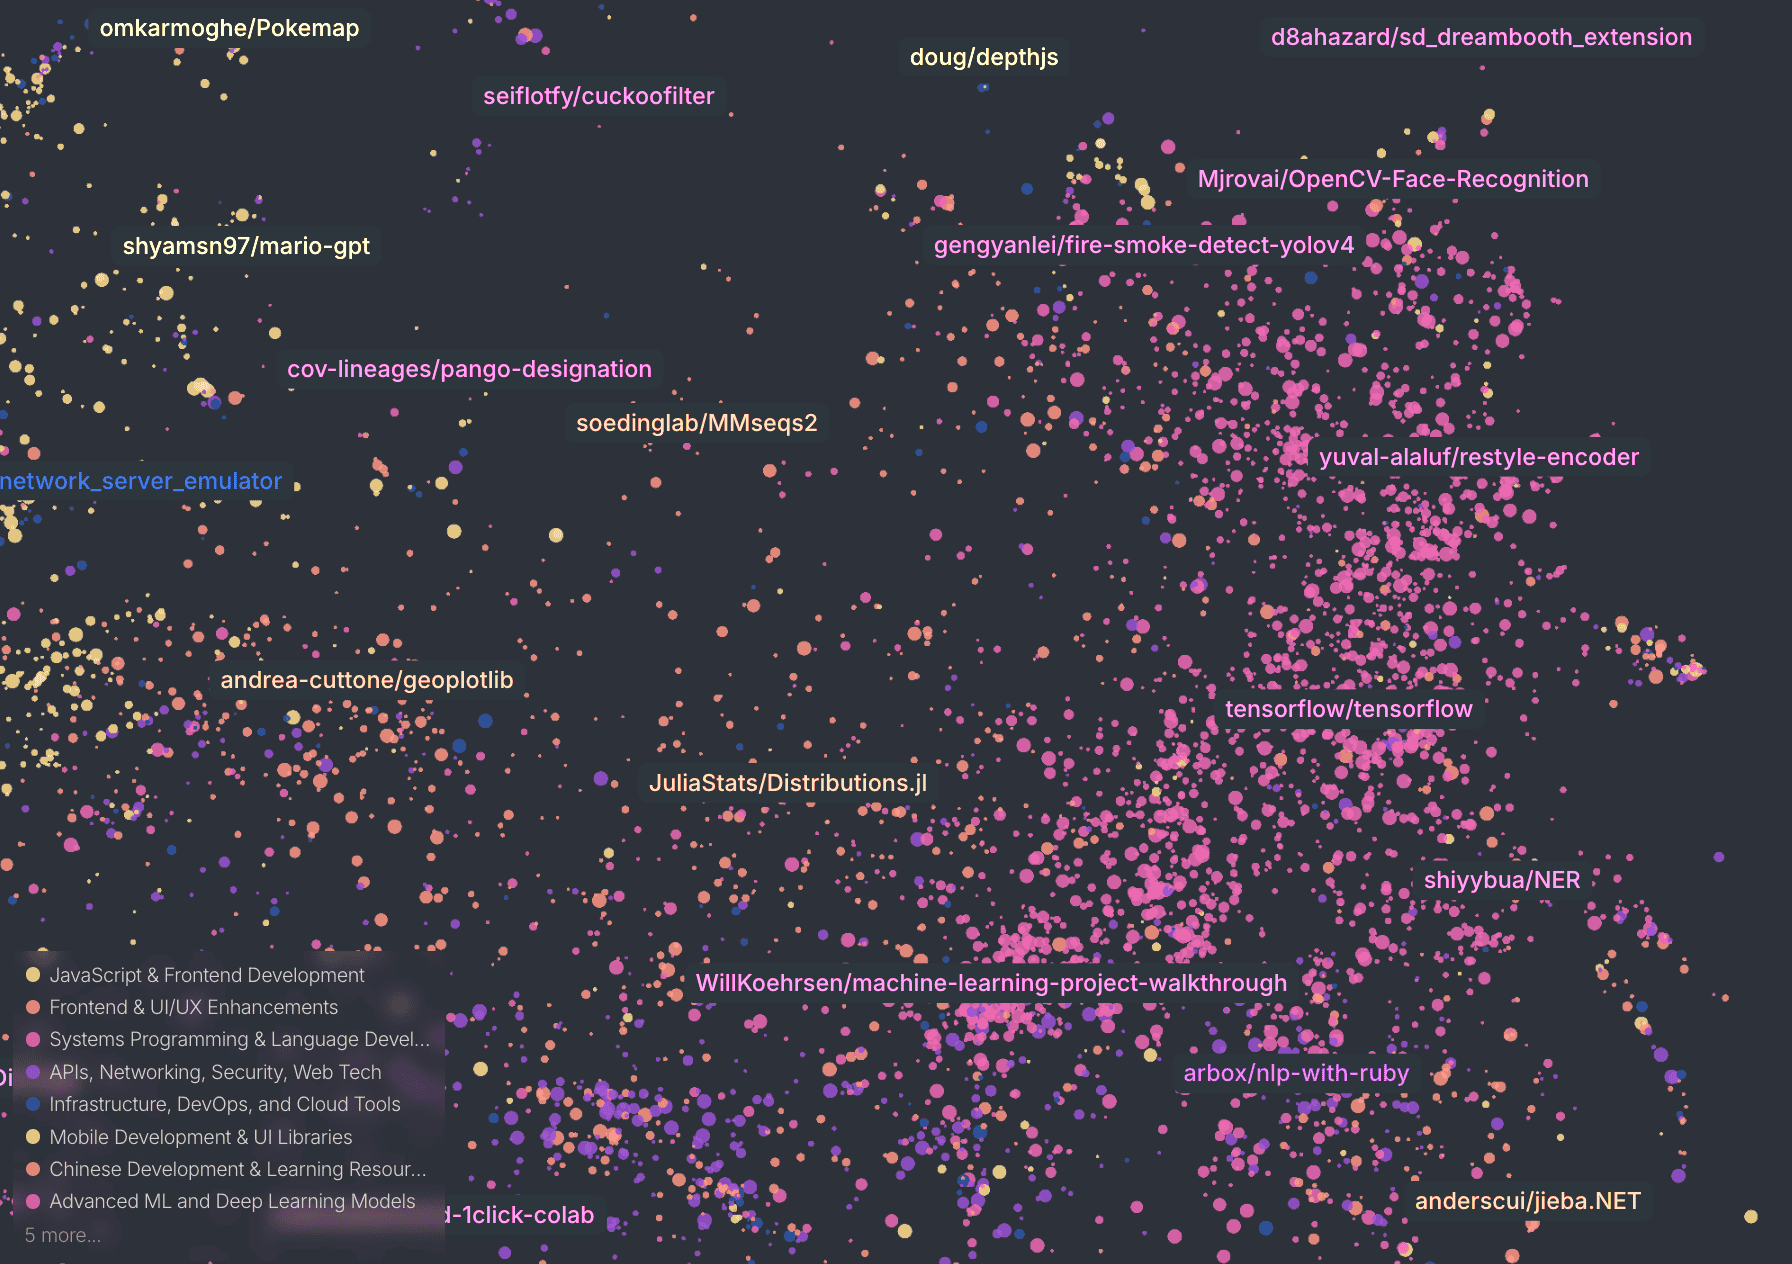
Network visualizations are fascinating, especially when you're dealing with large graphs. We hope you'll find Cosmograph useful and that it will help you with your projects. We can't wait to see what you build with it! If you like Cosmograph, please share it with your friends and colleagues, and give us your feedback!


βš™οΈ Behind the scenes​

Large-scale graph visualizations are tricky. The more nodes and edges you have in your network, the more difficult it is to compute the layout for it. Graph layout defines where on a canvas the nodes will be placed. No layout, no visualization!

Rendering a large number of nodes and edges is also challenging. For example, if you try to animate more than a few thousand objects with SVG, it will fail and you'll have to find another technique to do it. Can you take advantage of a GPU to help draw so many data points? Of course you can! Using WebGL to render complex visualizations is becoming more common these days. But is it possible to use the power of a GPU to calculate the layout of your graph? The answer is yes, with Cosmograph!

GPU-accelerated Force Layout​

One of the key techniques used in network graph visualization is a force layout. This is a type of physical simulation that defines various forces that act on the nodes of your graph. For example, a spring force between connected nodes will pull them together, a many-body repulsion force will push nodes away from each other, and a gravitational force will bring unconnected parts of the graph together in simulation space. There are many libraries that implement various types of force layout simulations. Almost all of them use the CPU to perform the computations, and they get slower as the number of nodes increases, usually choking at around 100,000 nodes.

GPU-based force layout algorithms are much less common; they are more difficult to write. Using the traditional approach to implementing the many-body force (which is the most complex force in the simulation) won't make the calculations noticeably faster because random memory access operations (reading or writing data from the computer's memory) are slow on GPUs, and you'll need a lot of them (i.e., when you need to get information about two different nodes to calculate the forces, and their data is far apart in memory).

When you need to visualize a large network, you usually have to use desktop visualization tools that first compute the layout using an optimized CPU algorithm, and then visualize the result. You can also use more sophisticated tools that compute the layout on their server and then render your graph in the browser using WebGL. Or a sophisticated and powerful command-line tools.

However, we have come up with a much more user-friendly solution. We developed a technique that allowed us to completely implement force graph simulation on the GPU. It is amazingly fast and it works on the web!

Questions? Contact us at
[email protected]